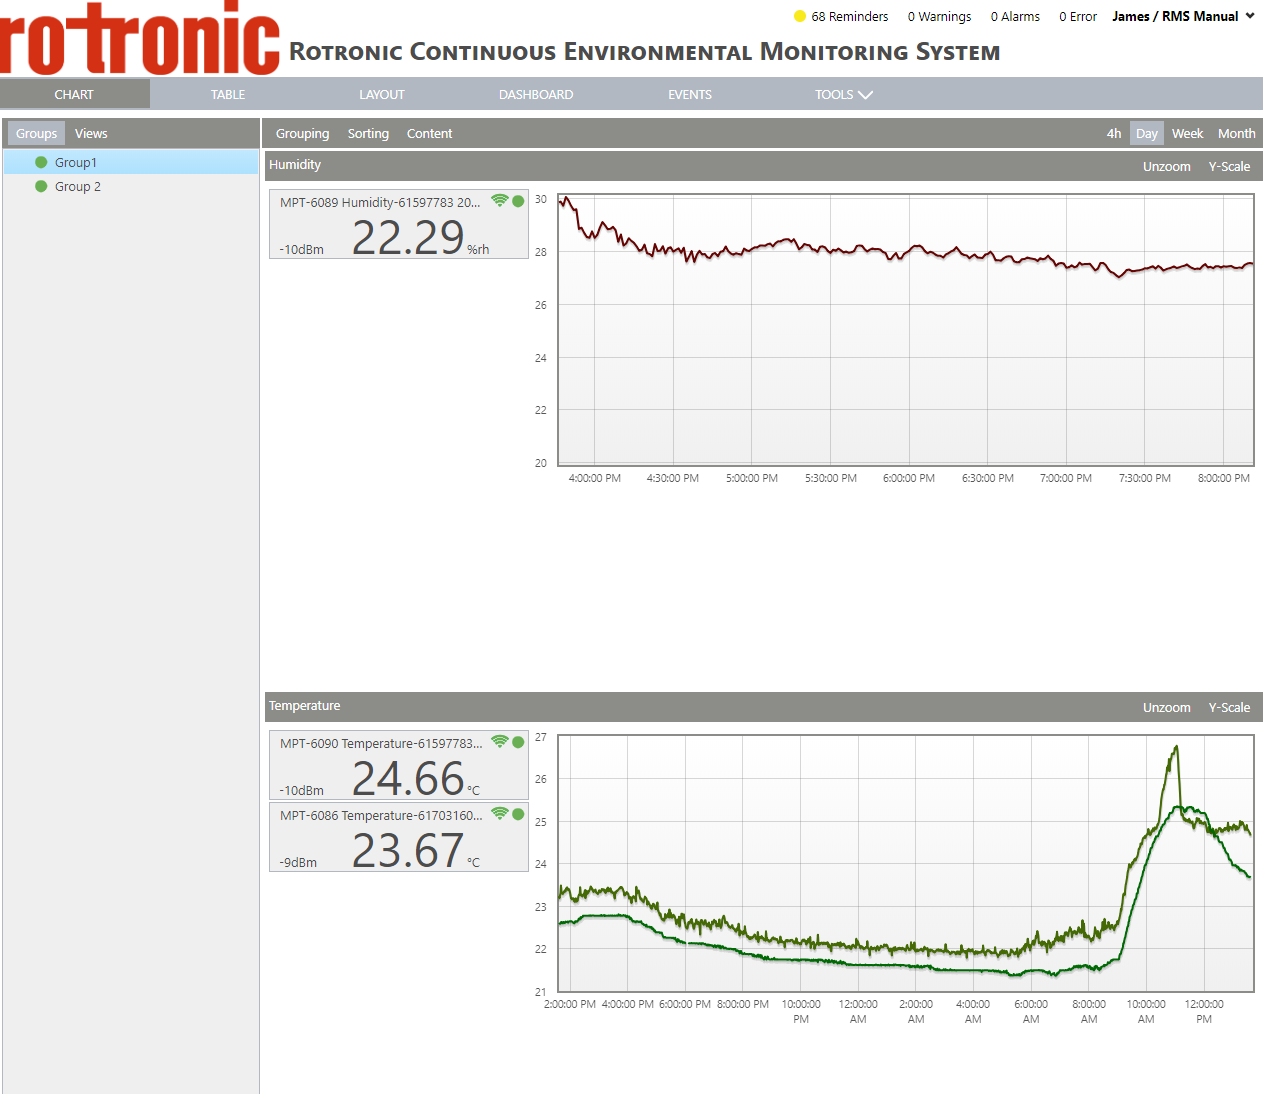
Configure your X-Scaling
Within the "Chart" view, standard X-scalings are possible:
4h: Shows the last 4 hours of data.
Day: Shows the last day of data.
Week: Shows the last week of data.
Month: Shows the last month of data.
It is also possible to zoom in: using the mouse, click and drag function over the desired time frame.
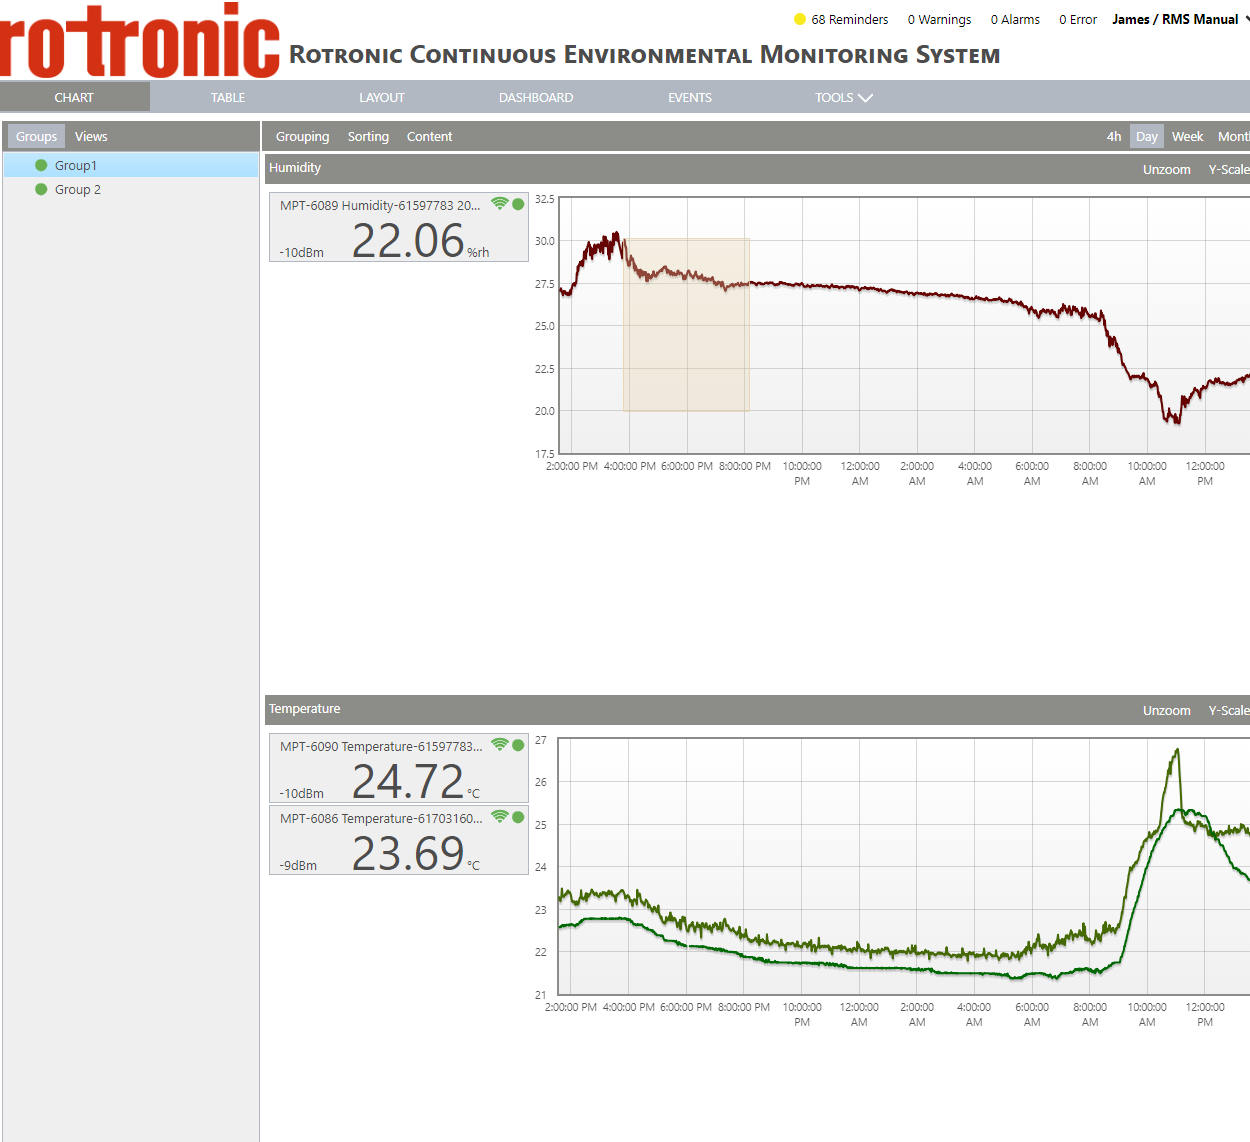
To zoom back out: simply click on the "Unzoom" button.
To see all groups over the same x-scale, click on "Sync x-axis" under the "Content" menu:
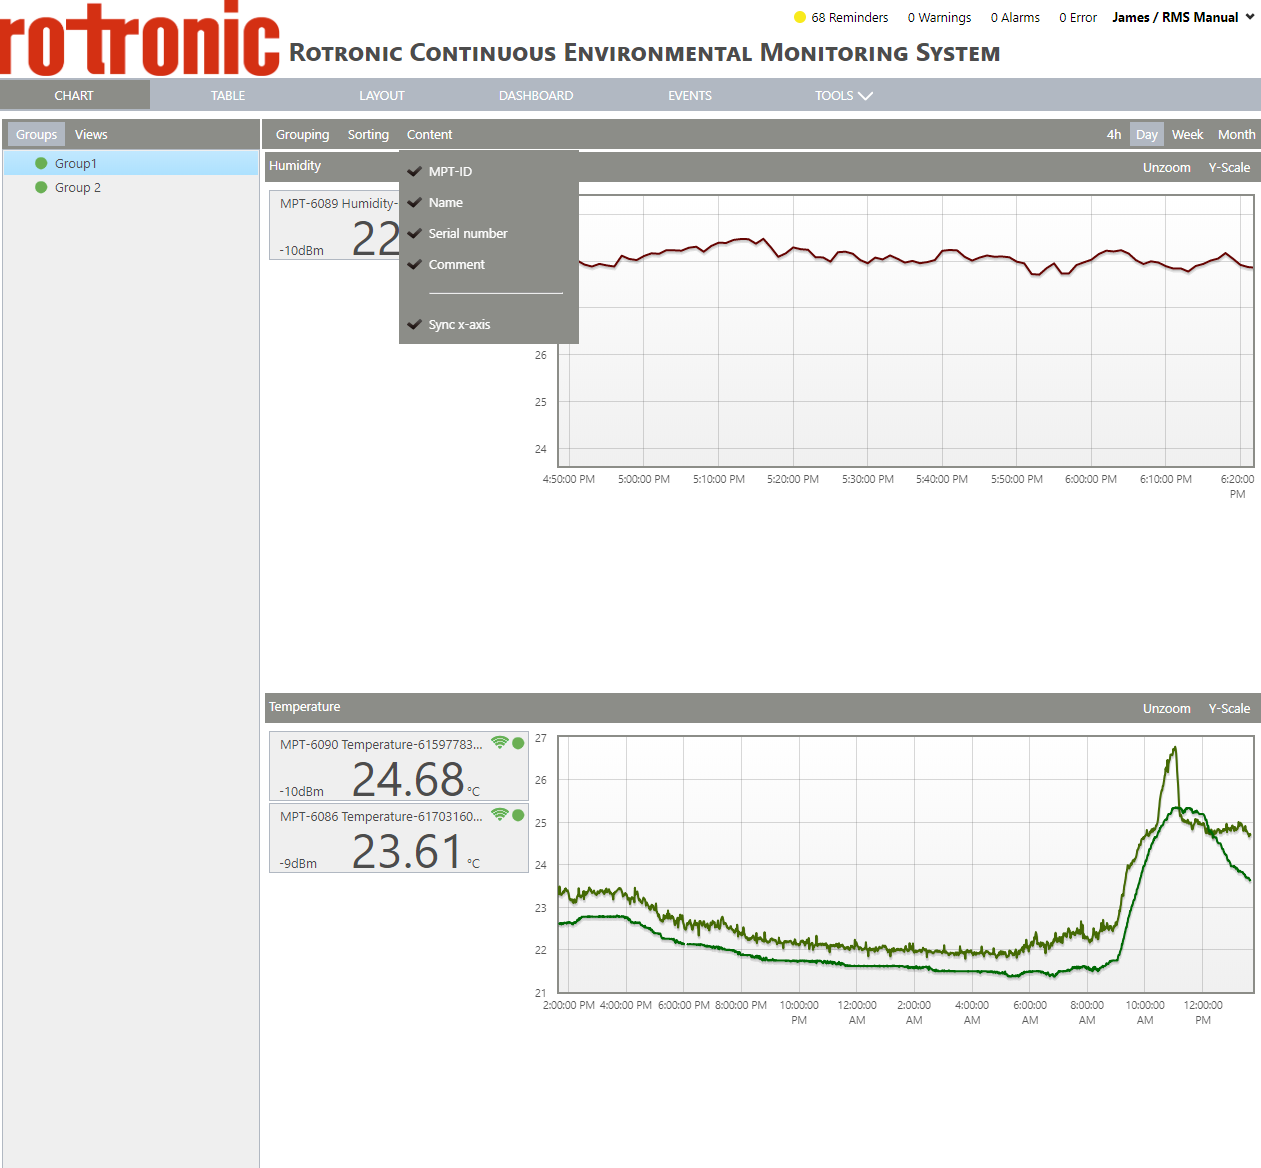
Sync x-axis: when the "sync x-axis" is ticked, the x-axis from the various measuring points will all be synced. When not ticked, only the measuring point where a zoom is has been carried out will be zoomed.