Chart Explained
The chart is the landing page when logging into RMS.
The chart is a visualization tool.
The chart also offers short cuts to inhibit measuring points and switch buttons and outputs.
| Print Screen 1 | In the chart view various visualization options are available. Under the Groups, it is possible to see the group structure and click either on one or more groups (SHIFT or CONTROL). All of the measuring points from the group will then appear. The user can select a time range from 4 hours, day, week or month. When showing data, slots are formed, each with (total measured values/500) values. The smallest and largest value is returned from each slot. 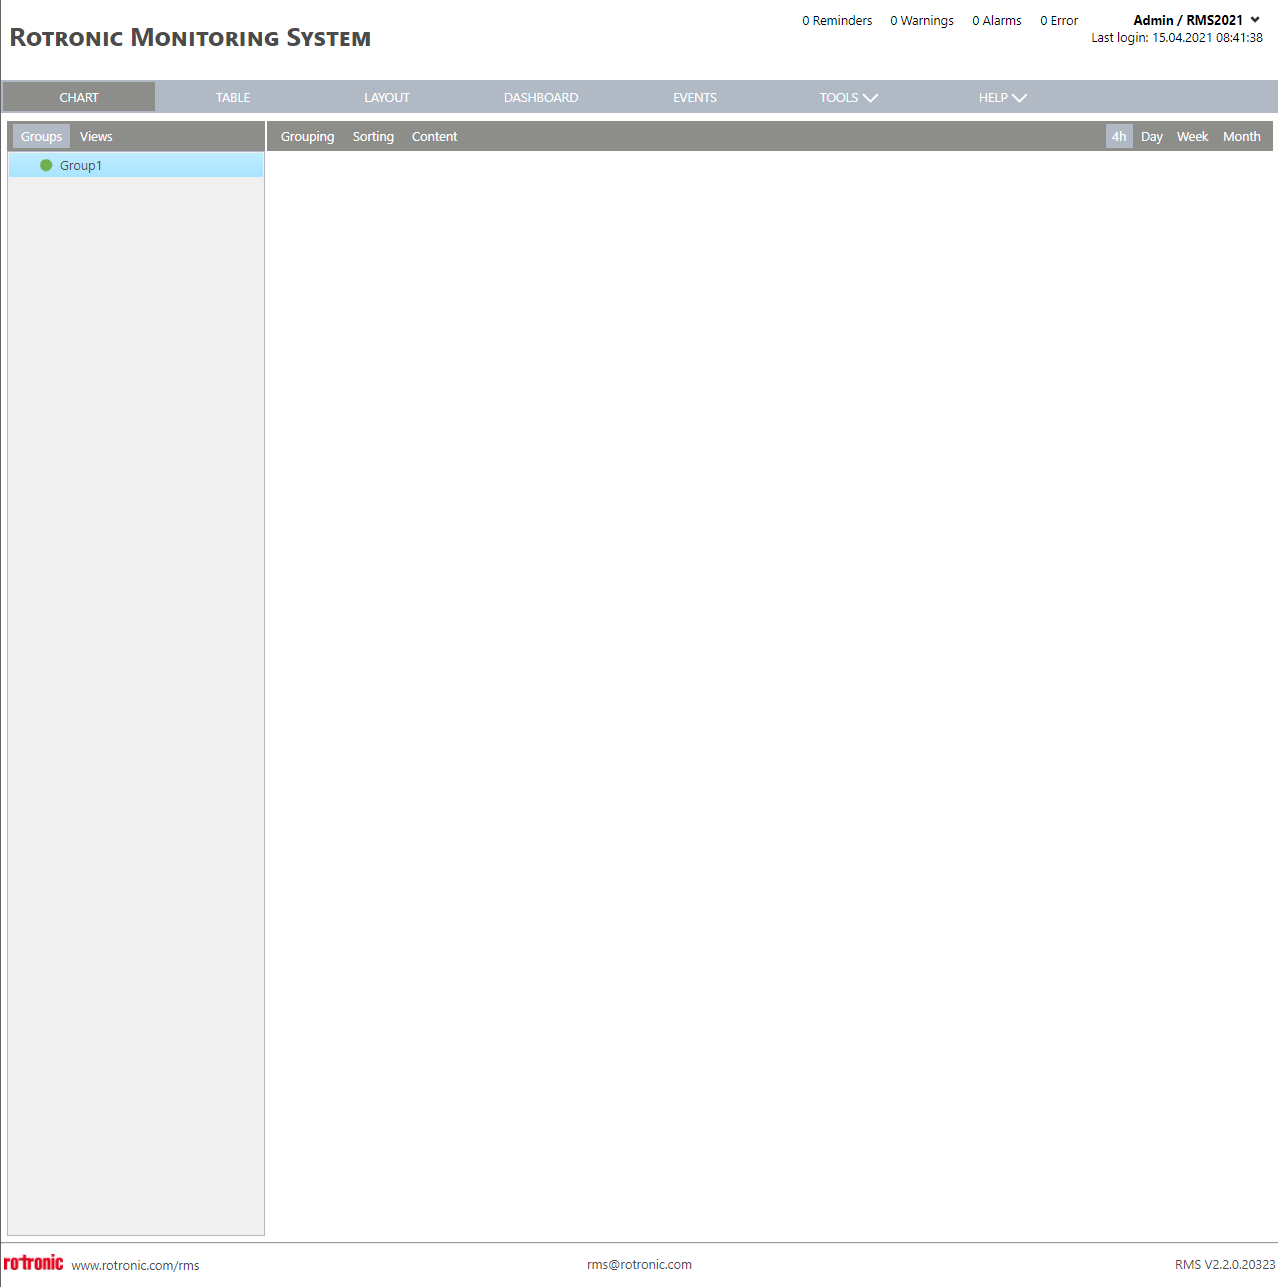 |
|---|---|
| Print Screen 2 | Under the Groups view, the user can define how the measuring points are grouped via the grouping function. 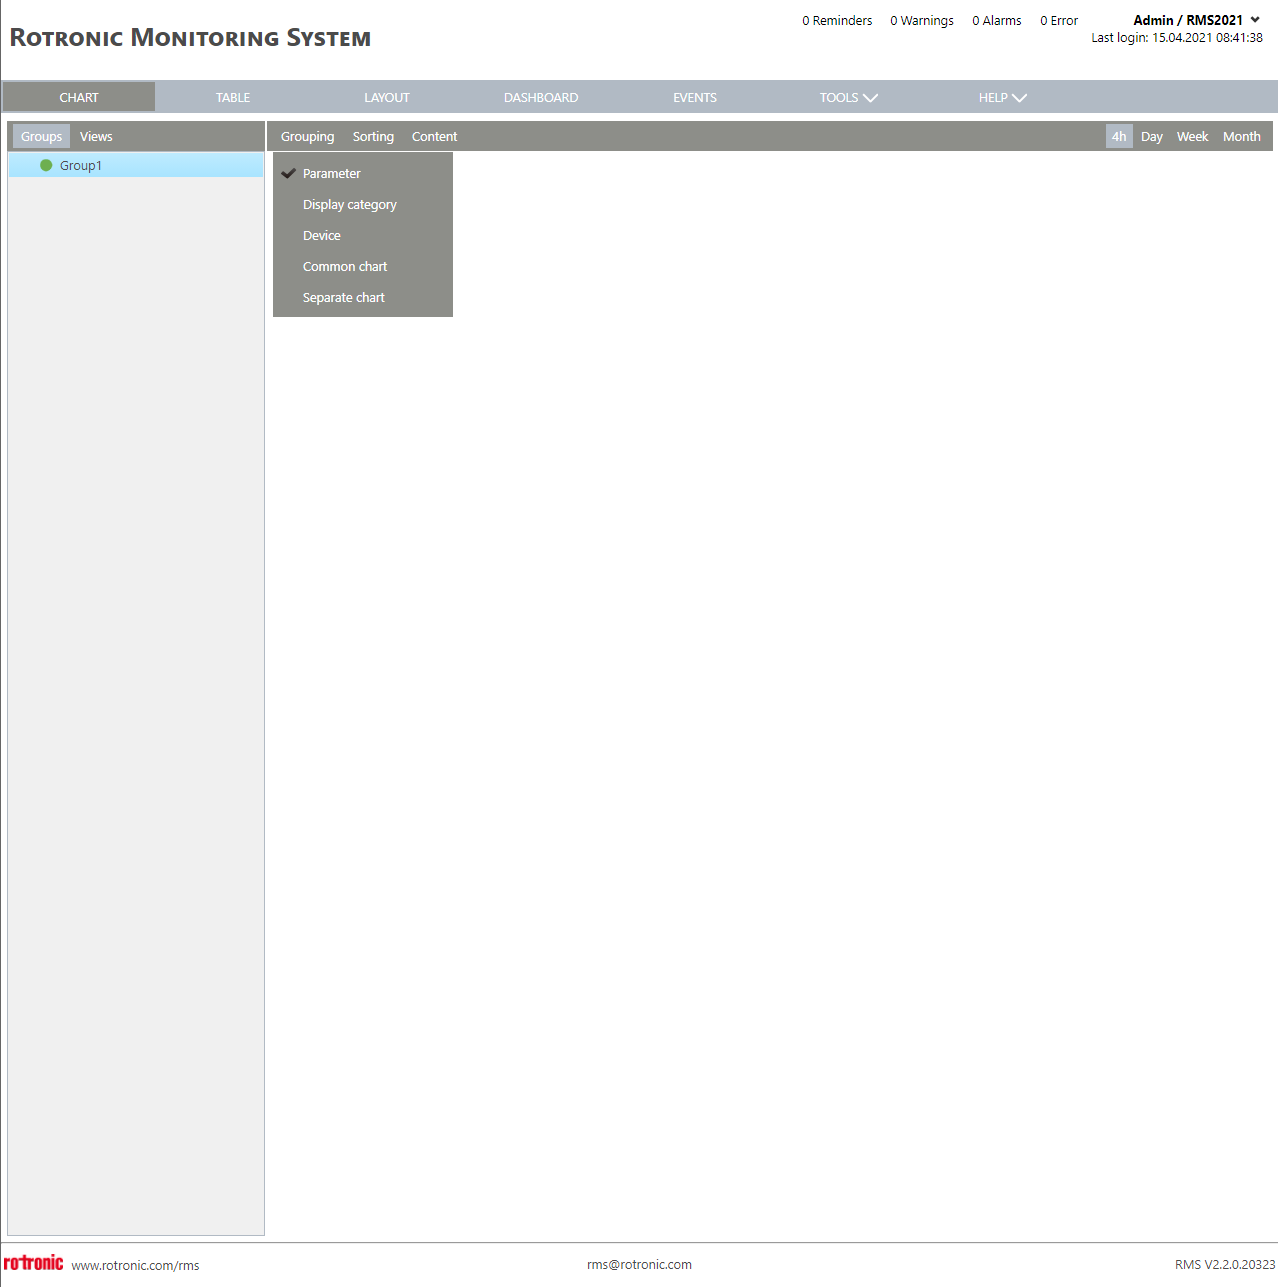 |
| Print Screen 3 | Under the Groups view, the user can define how the measuring points are sorted via the sorting function. 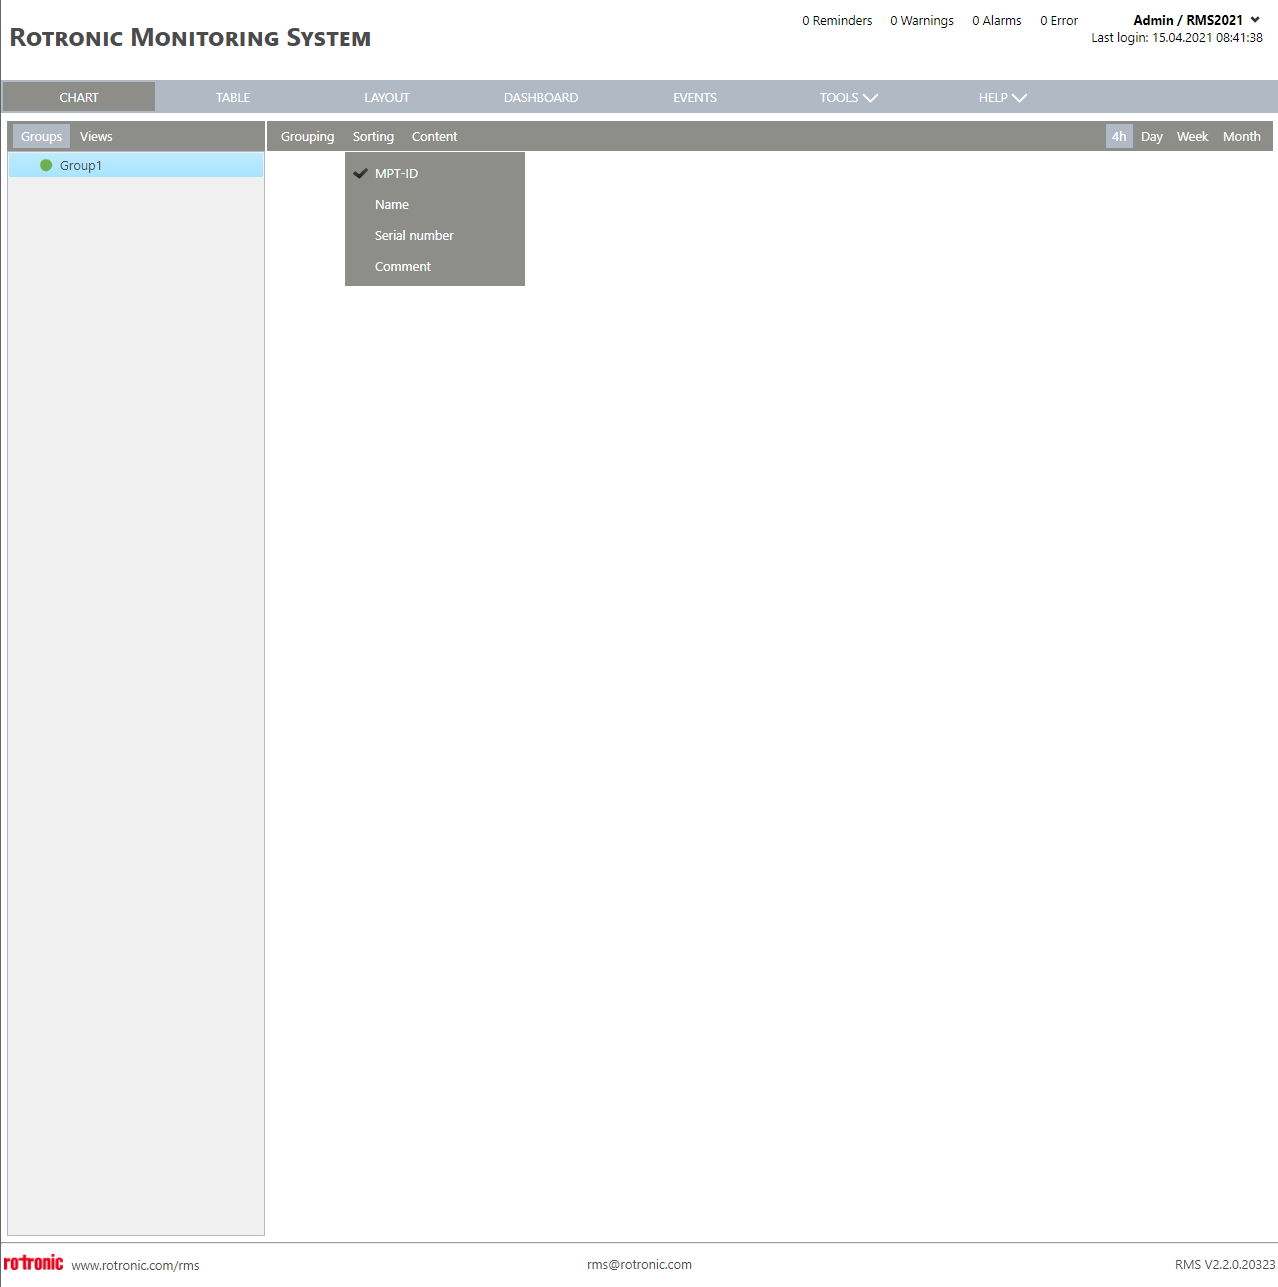 |
| Print Screen 4 | Under the Groups view, the user can define what content is shown for each measuring point via the content function. 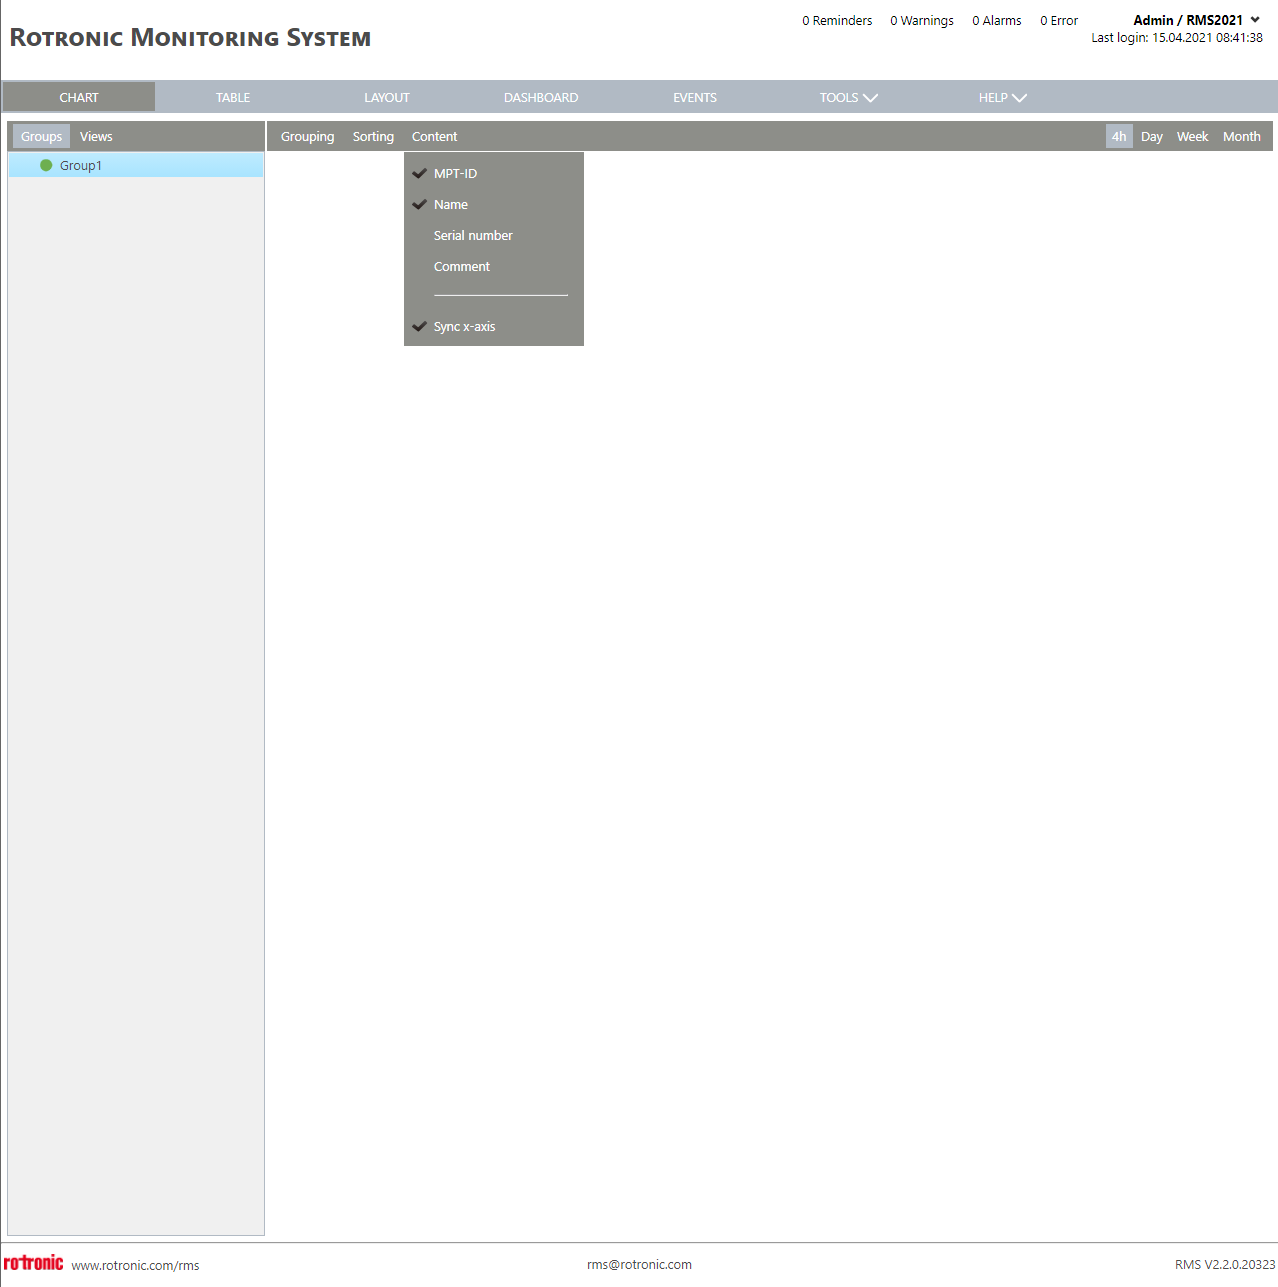 |
| Print Screen 5 | In the chart view various visualization options are available. Under the Views, it is possible to see user defined views and select either one or more views. All of the measuring points from the views will then appear. IMPORTANT: Views created are only visible by the user who created the views. The user can select a time range from 4 hours, day, week or month. 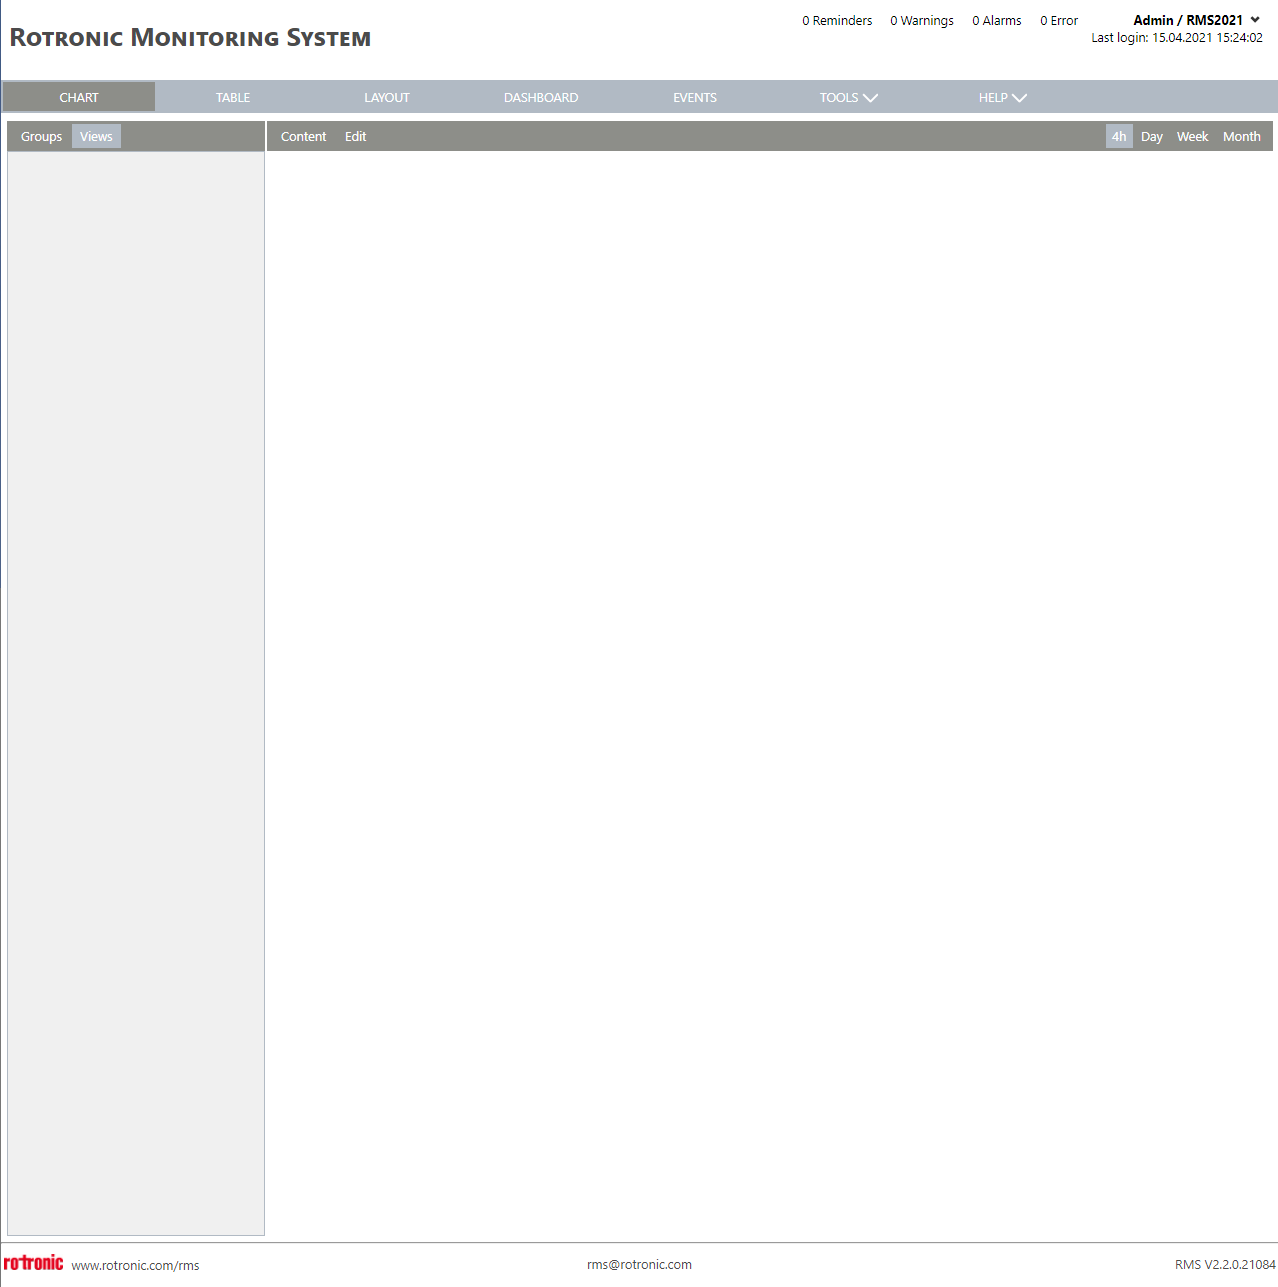 |
| Print Screen 6 | Under the Views view, the user can define what content is shown for each measuring point via the content function. 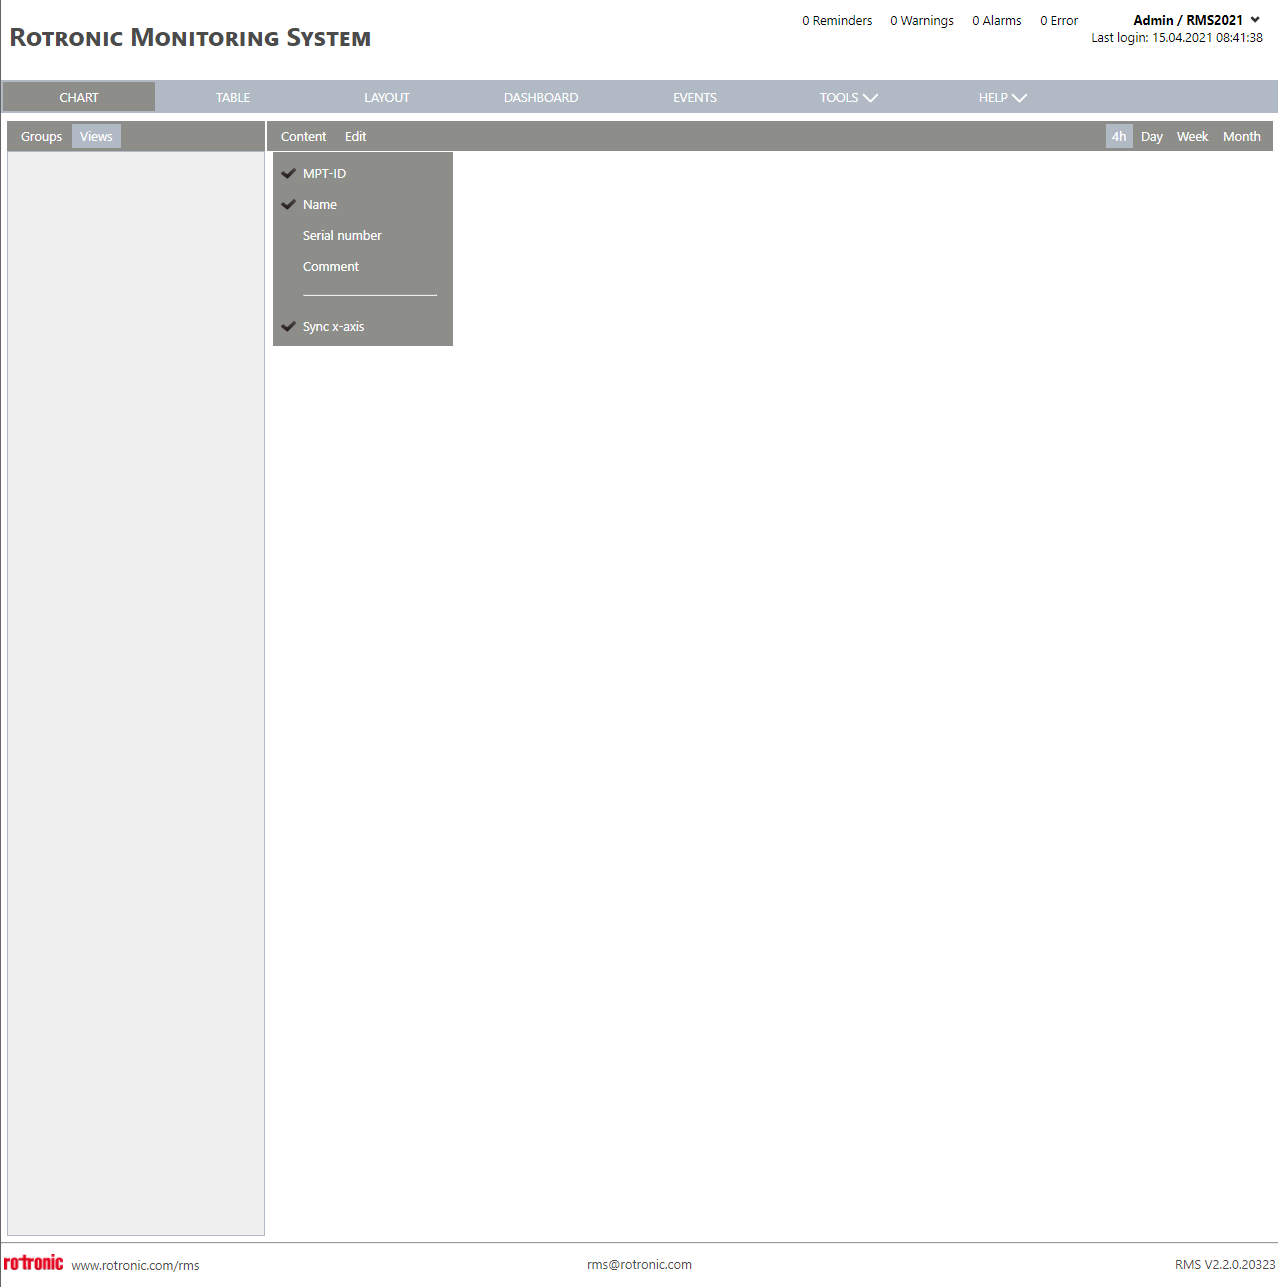 |
| Print Screen 7 | Under the Views view, the user can edit views and add categories. 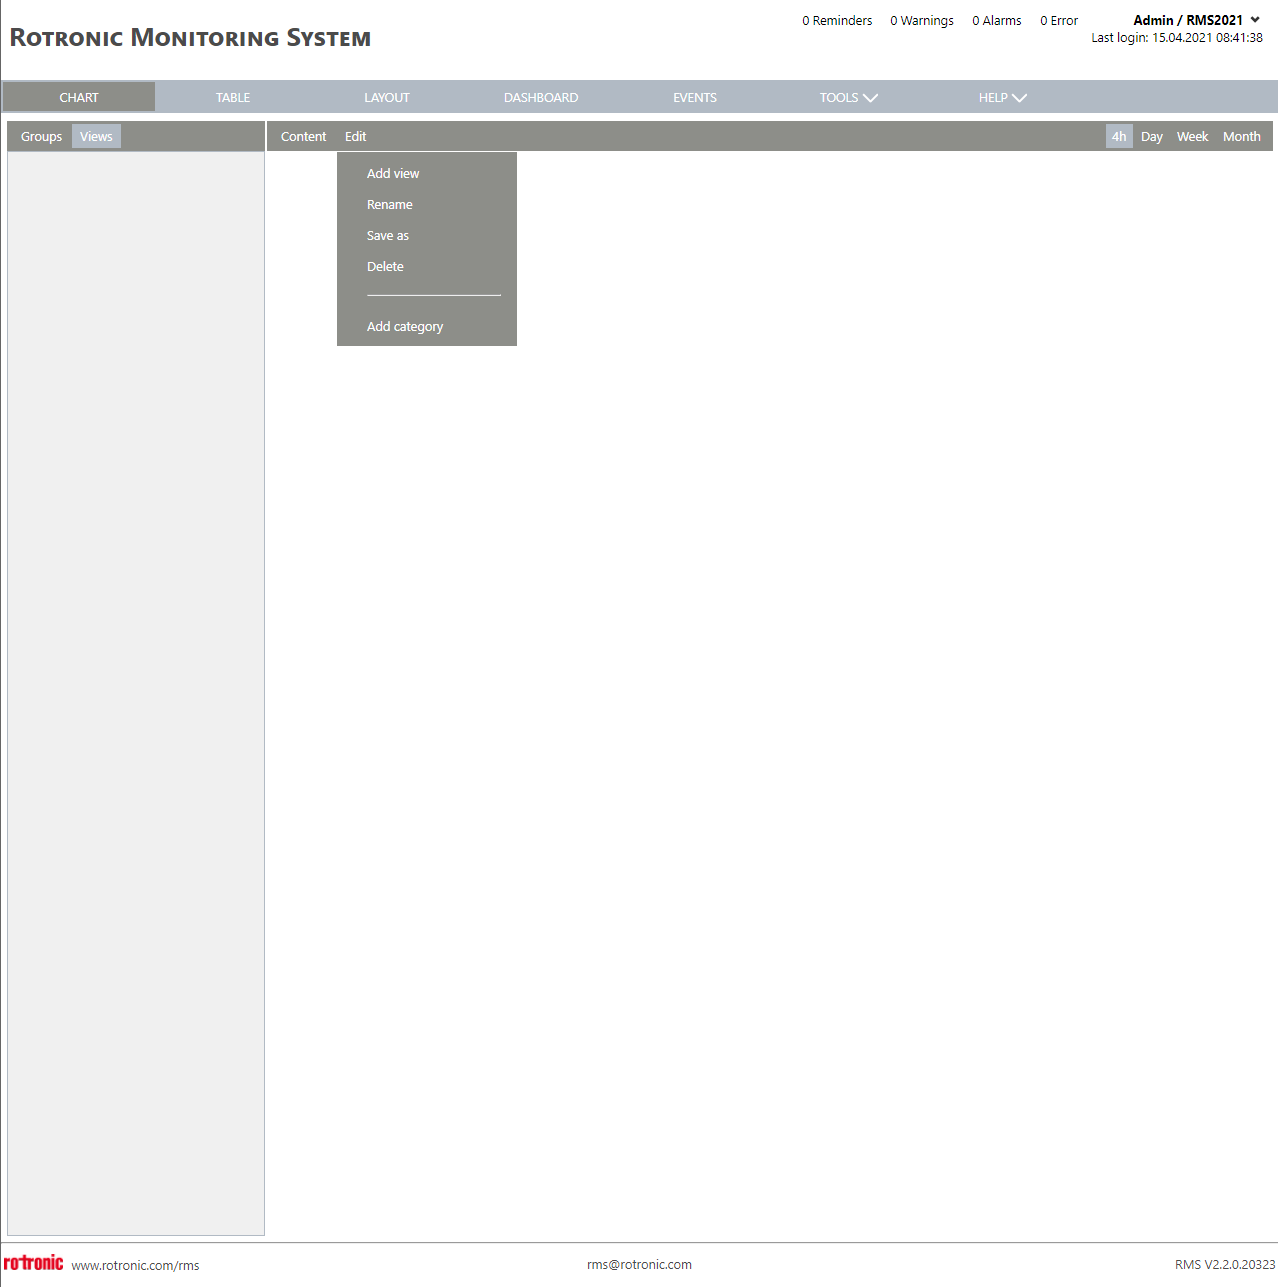 |
| Print Screen 8 | Under the Views view>Edit>Add view, the user can add a new view. 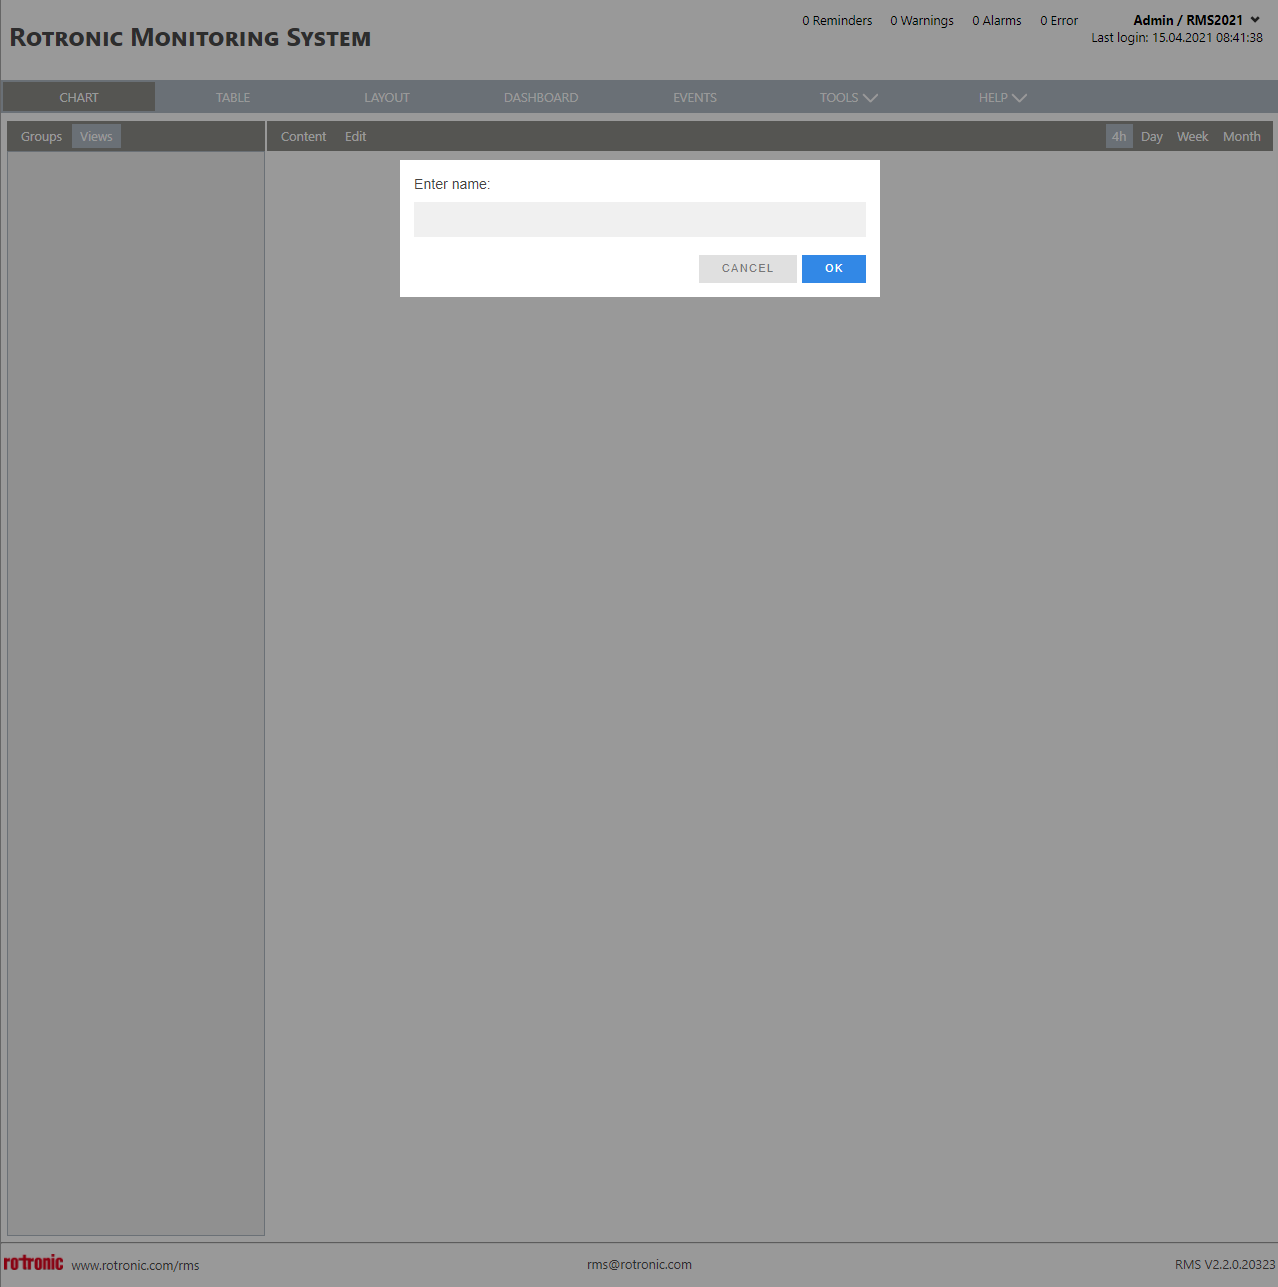 |
| Print Screen 9 | Under the Views view all views created are visible. 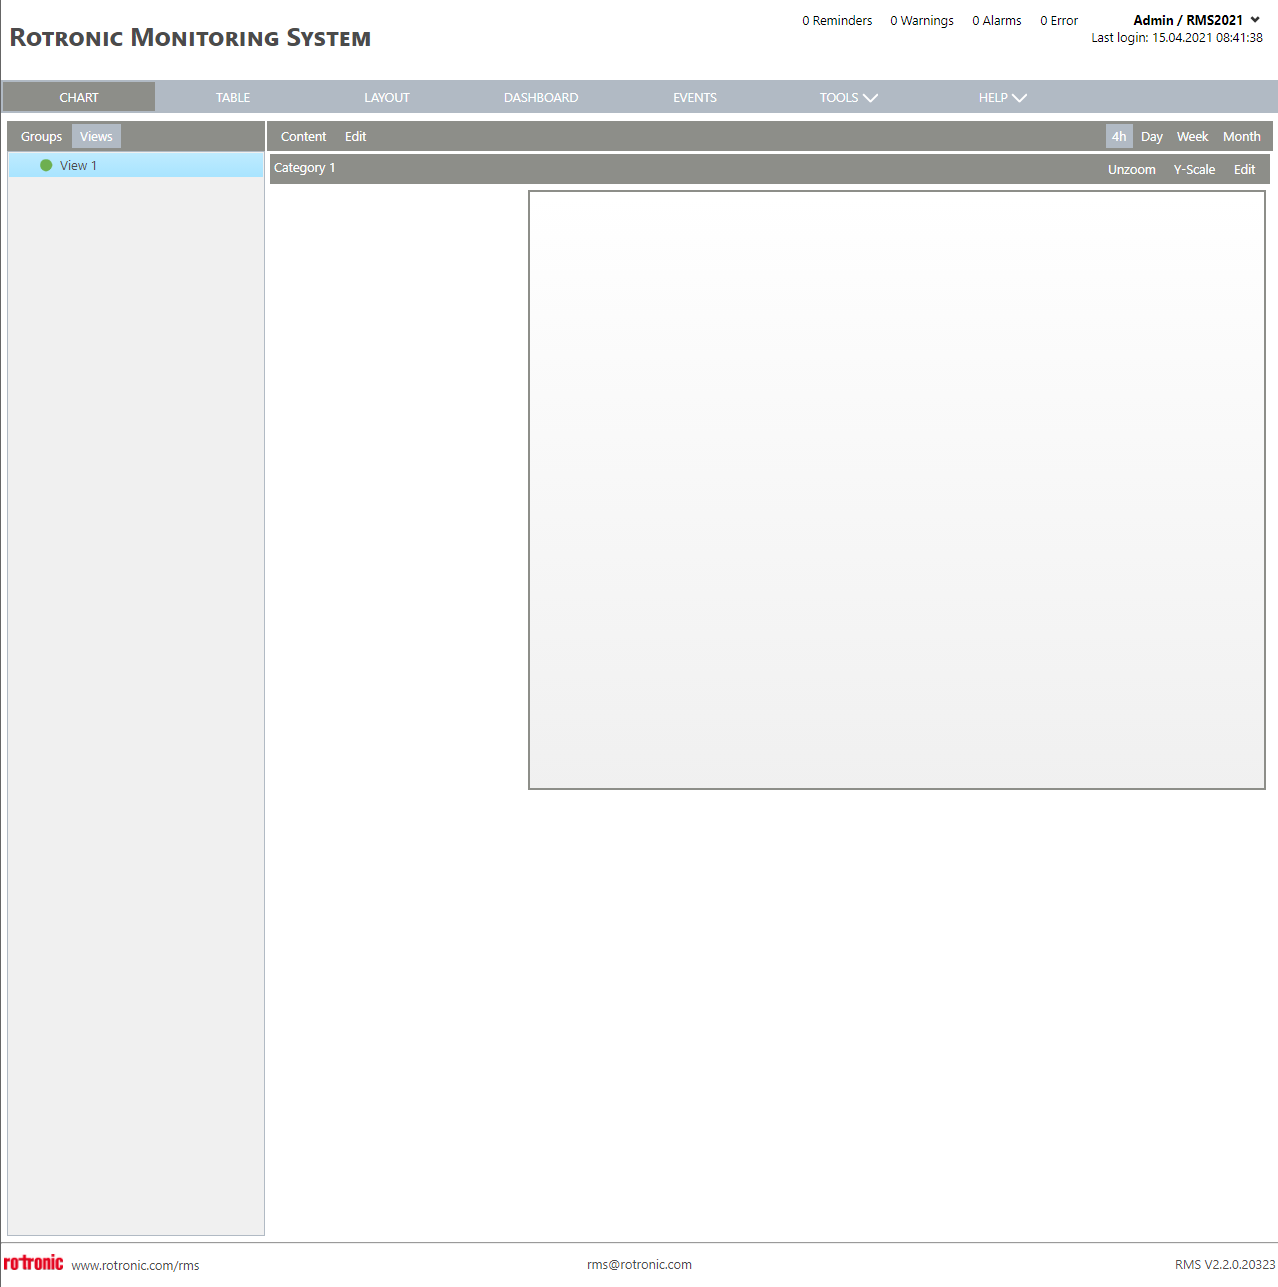 |
| Print Screen 10 | Once a view created, by clicking on Edit under Category 1, it is possible to add the desired measuring points. 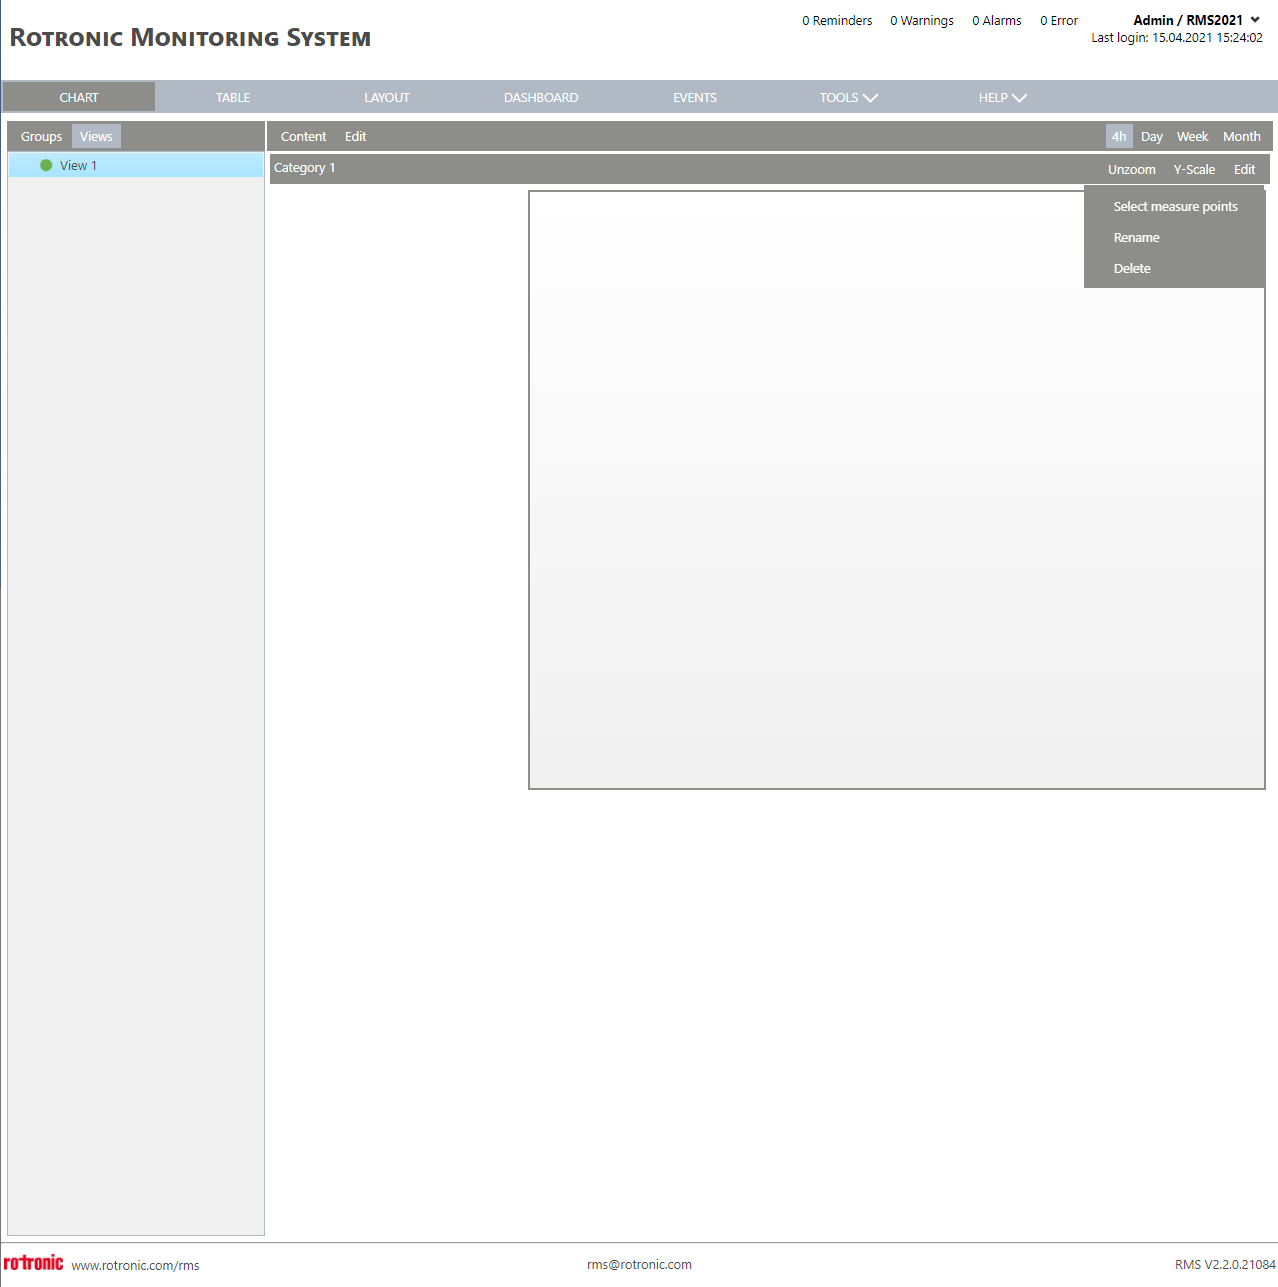 |
| Print Screen 11 | Under the Views view>Edit>Add category, the user can add a new category. |
| Print Screen 12 | Under the Views view all categories created are visible. New measuring points can be added to Category 2, by clicking on Edit add measuring points. 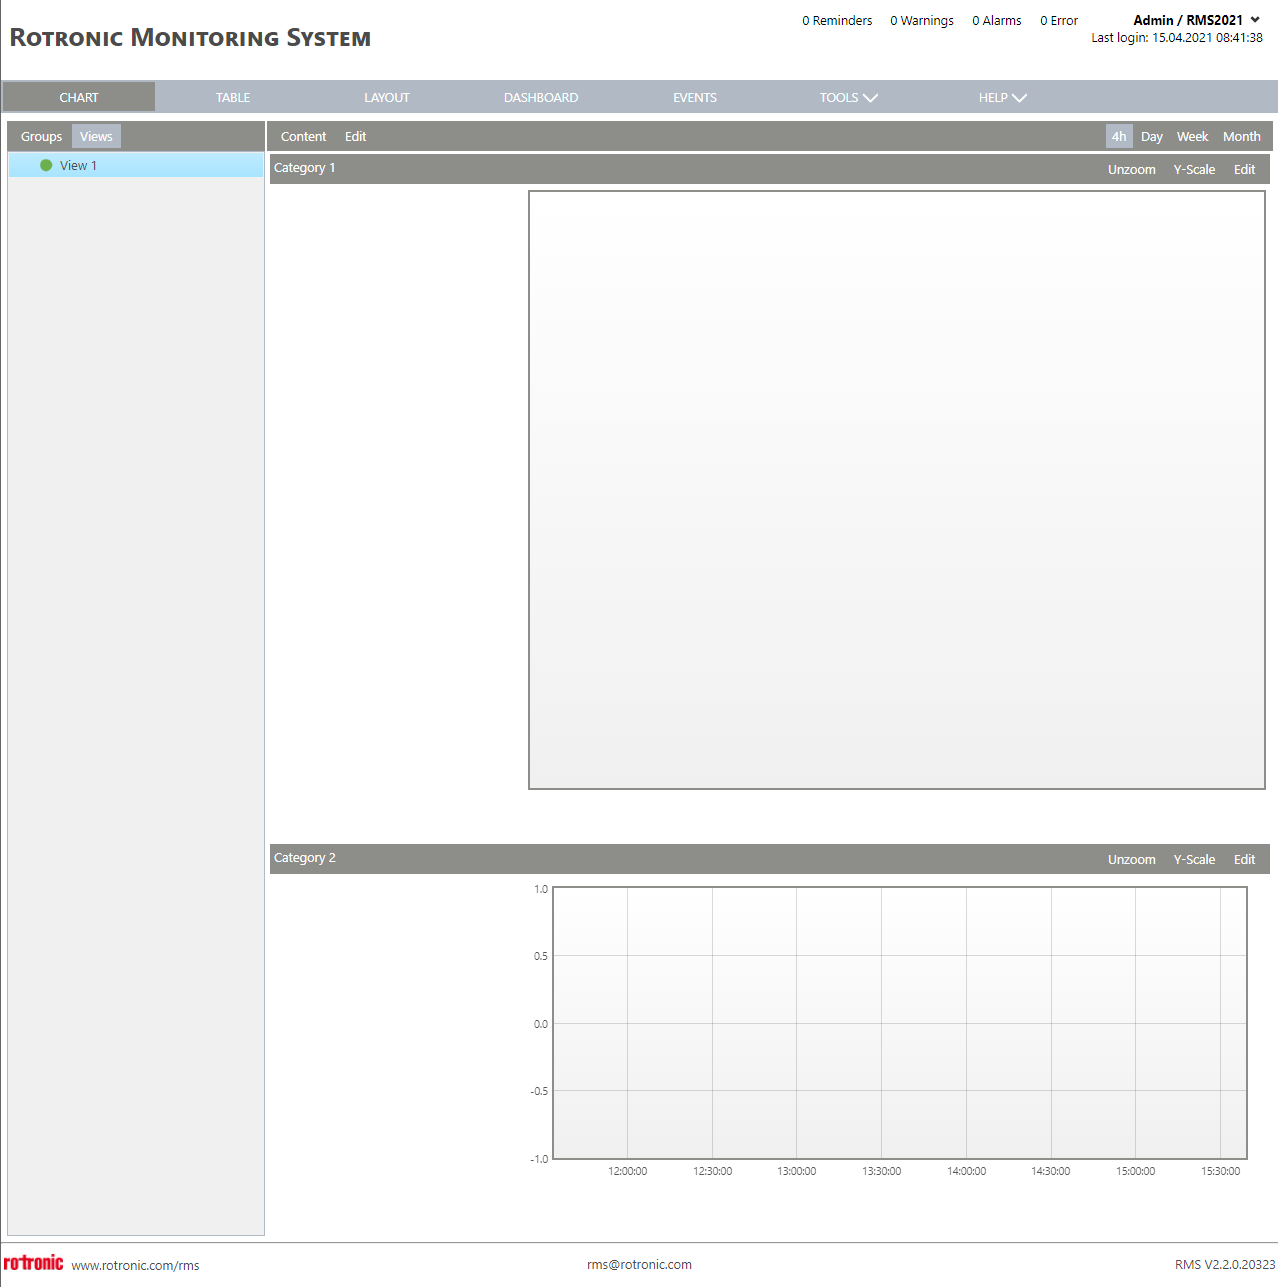 |