Dashboard Explained
The dashboard is a individualized visualization tool.
The dashboard also offers short cuts to inhibit measuring points and switch buttons and outputs.
| Print Screen 1 | In the dashboard view, the actual status of the measuring points as well as a historical values can be visualized together with the event table. The individual dashboards can be renamed simply by clicking on the dashboard name. 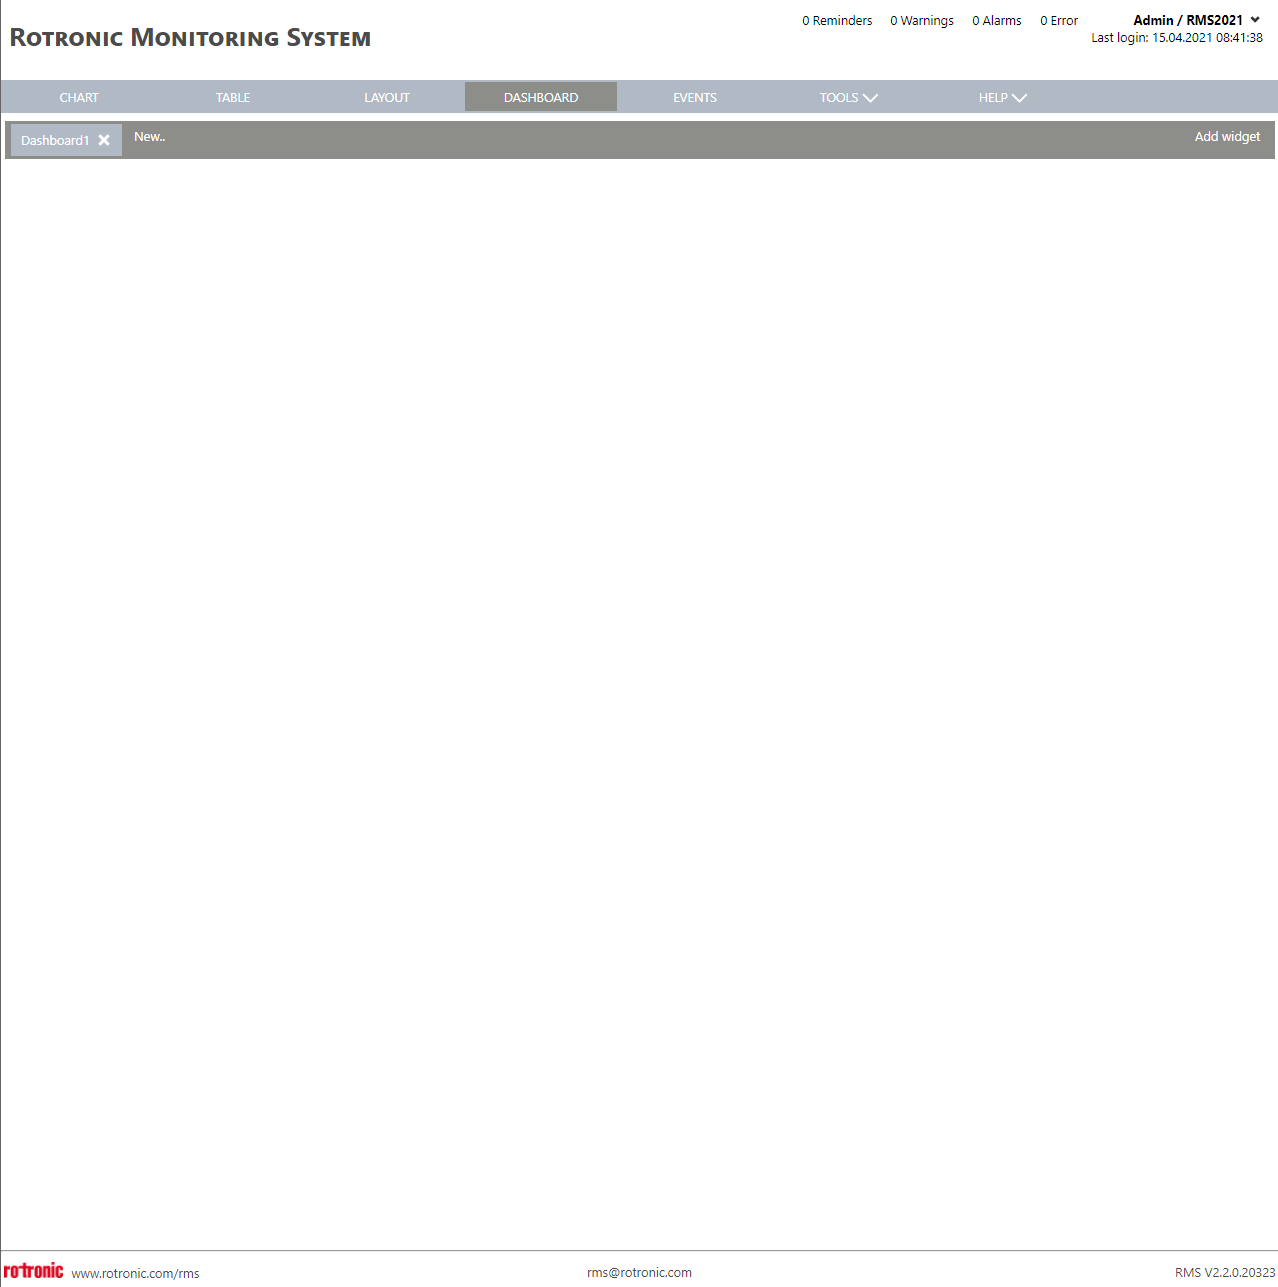 |
|---|---|
| Print Screen 2 | A new dashboard can be added by clicking on New. 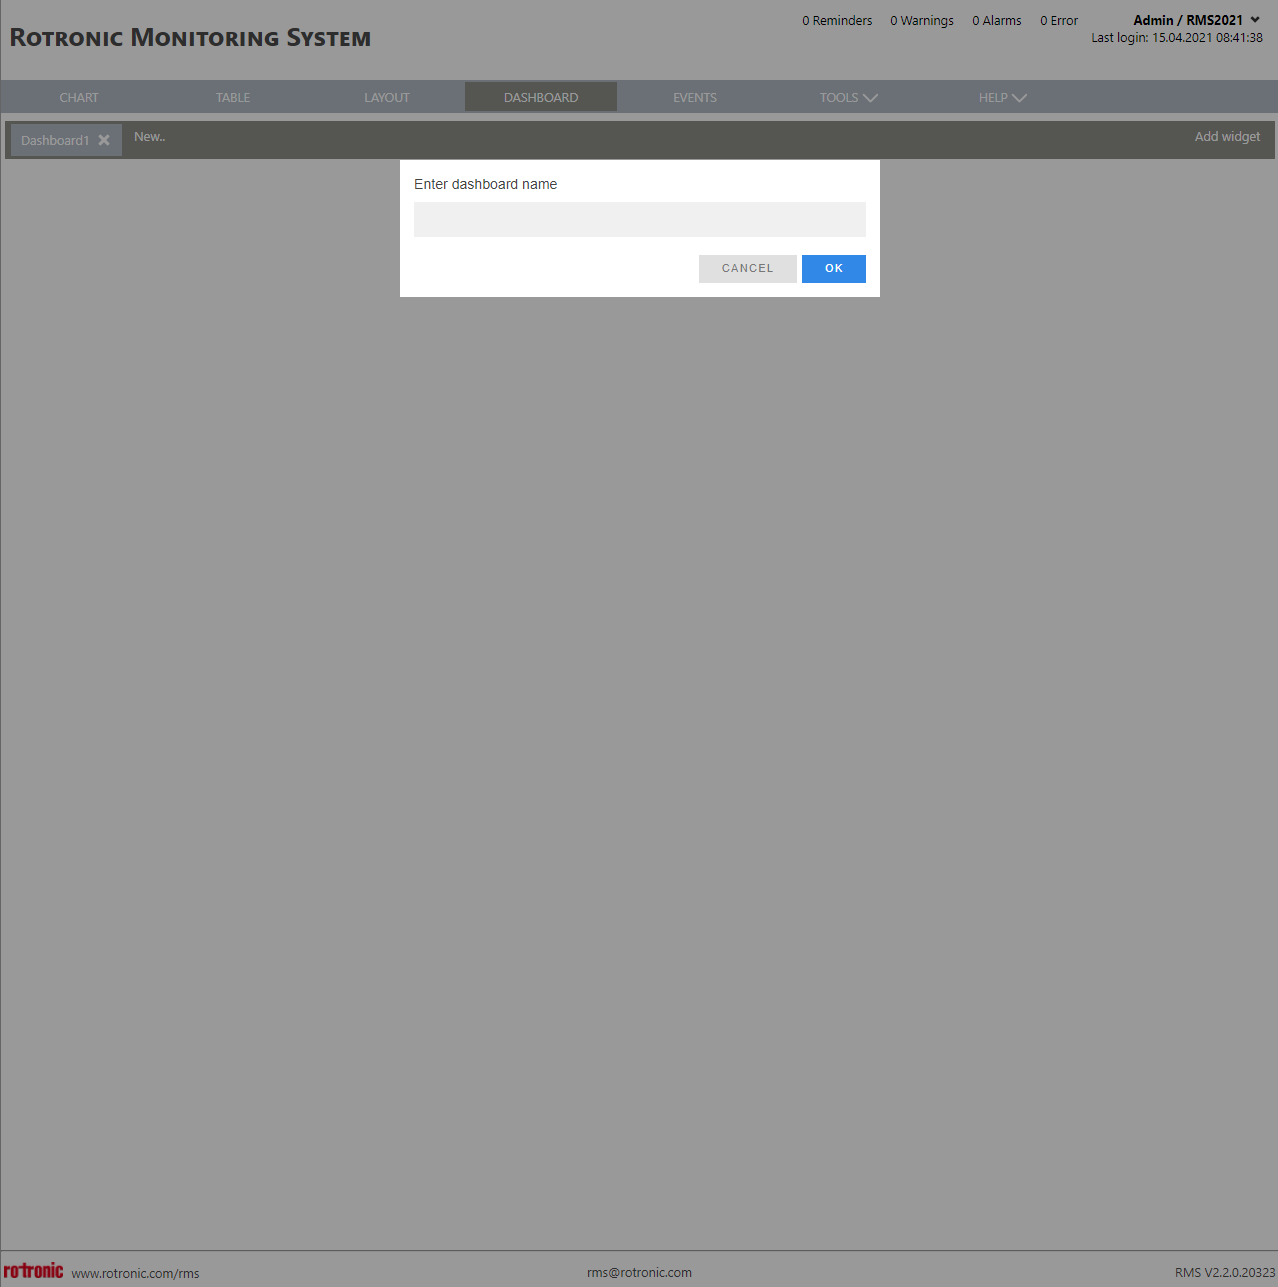 |
| Print Screen 3 | Widgets can be added to the dashboards by clicking on add widget. 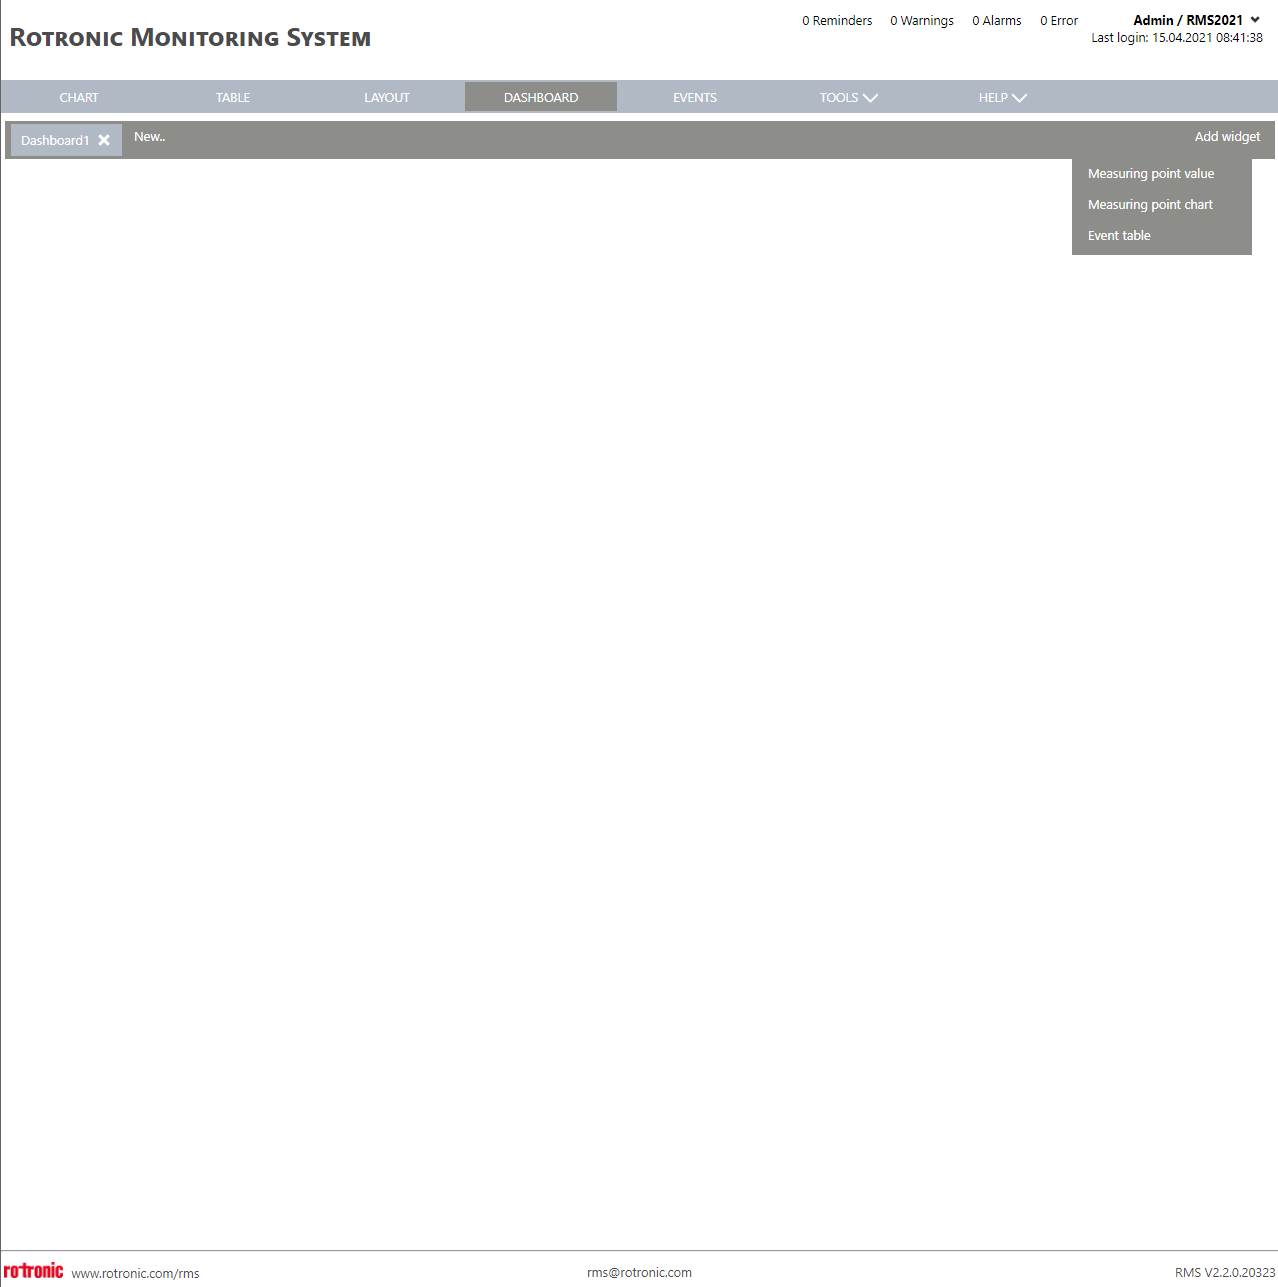 |
| Print Screen 4 | Add a measuring point value by clicking on add widget>Measuring point value. 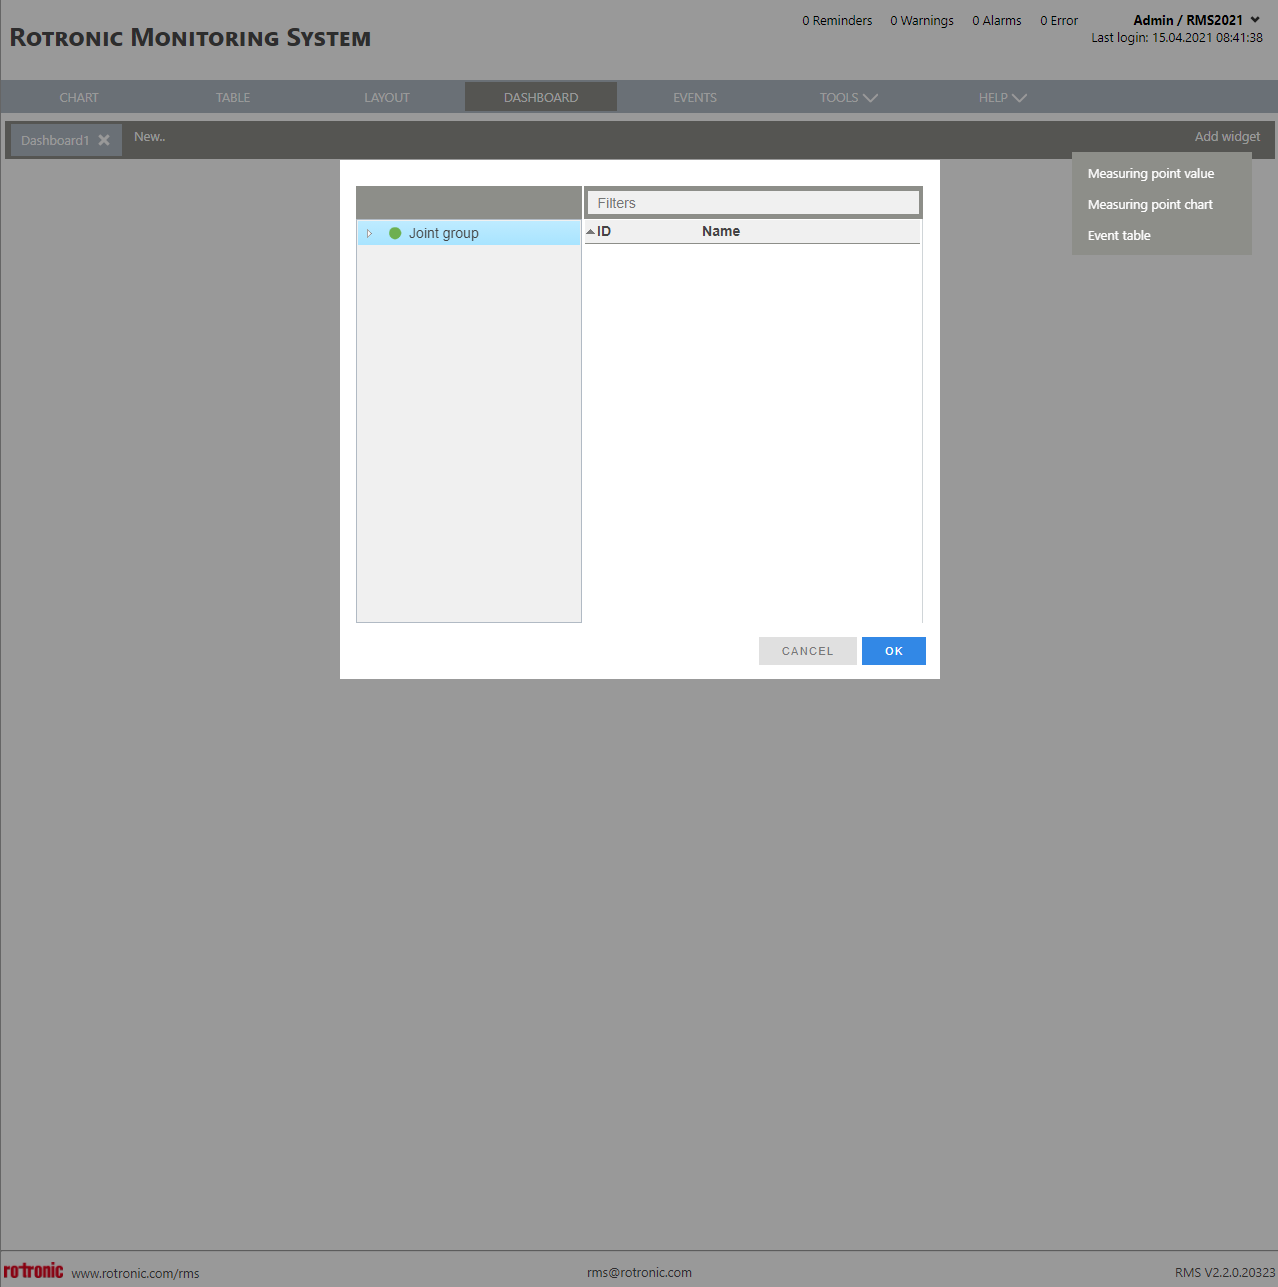 |
| Print Screen 5 | Add a measuring point chart by clicking on add widget>Measuring point chart. |
| Print Screen 6 | Add the event table clicking on add widget>Event table. 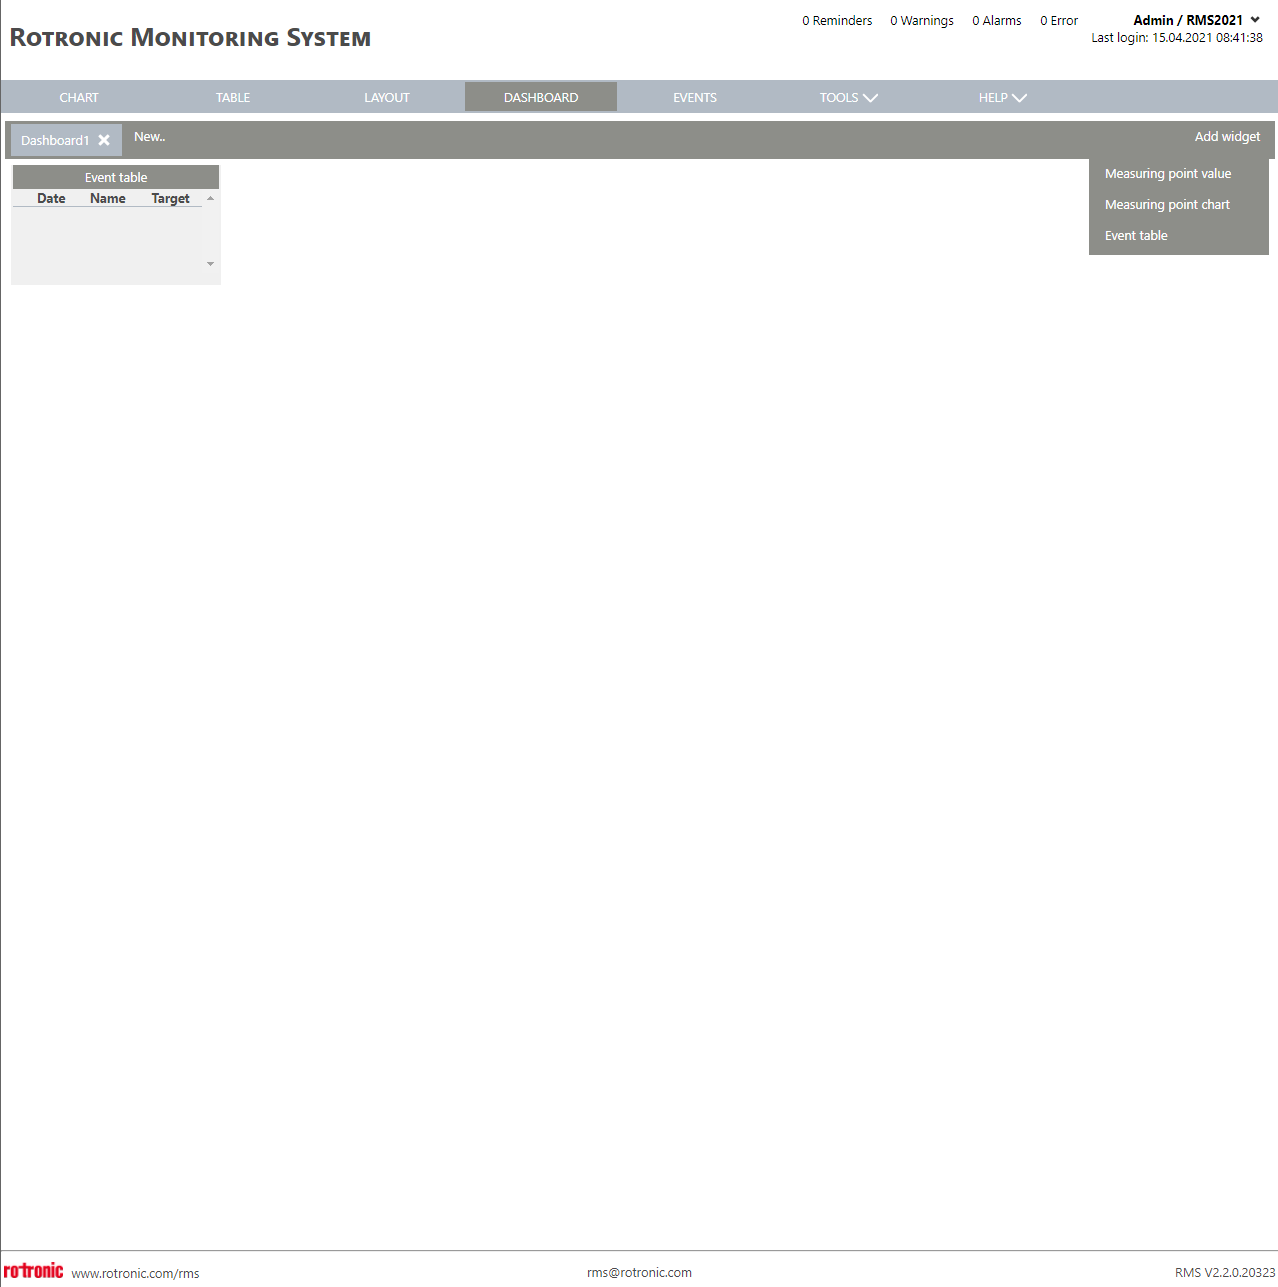 |