Tools>Data Analysis Explained
The data analysis is a visualization tool with an export function.
| Important: Data export: - When a manual PDF is created with >10'000 events, an error message will be shown to the user. - When a manual CSV is created with >50'000 events, an error message will be shown to the user. - When an automated PDF is created with >10'000 events, multiple reports will be created and sent by E-Mail. Maximum number of reports: 50. |
|---|
Important feature: within the data analysis, it is possible to check and generate data gaps.
| Overview | Under navigation the user can select a time frame. Under groups the user can select one or more groups (SHIFT or CONTROL). The user can then select one or more measuring points (SHIFT or CONTROL). Various visualizations are then available. When first opening the page, the chart visualization is selected. A chart of the selected measuring points over the selected time period will appear. The chart is limited to 1 million measurements (for example, at a 10s measurement interval, roughly only 4 months of data will be shown). When a chart is selected, an alarm band can also be selected. All alarm bands of all selected measuring points will appear in a drop down menu when selecting alarm bands. Important: ** - The user can change the size of the groups/measuring points and visualization compartments. - The chart line will only be empty if a data gap is detected and "---" is stored within the database. Until this time a straight line will join the last and first values.** 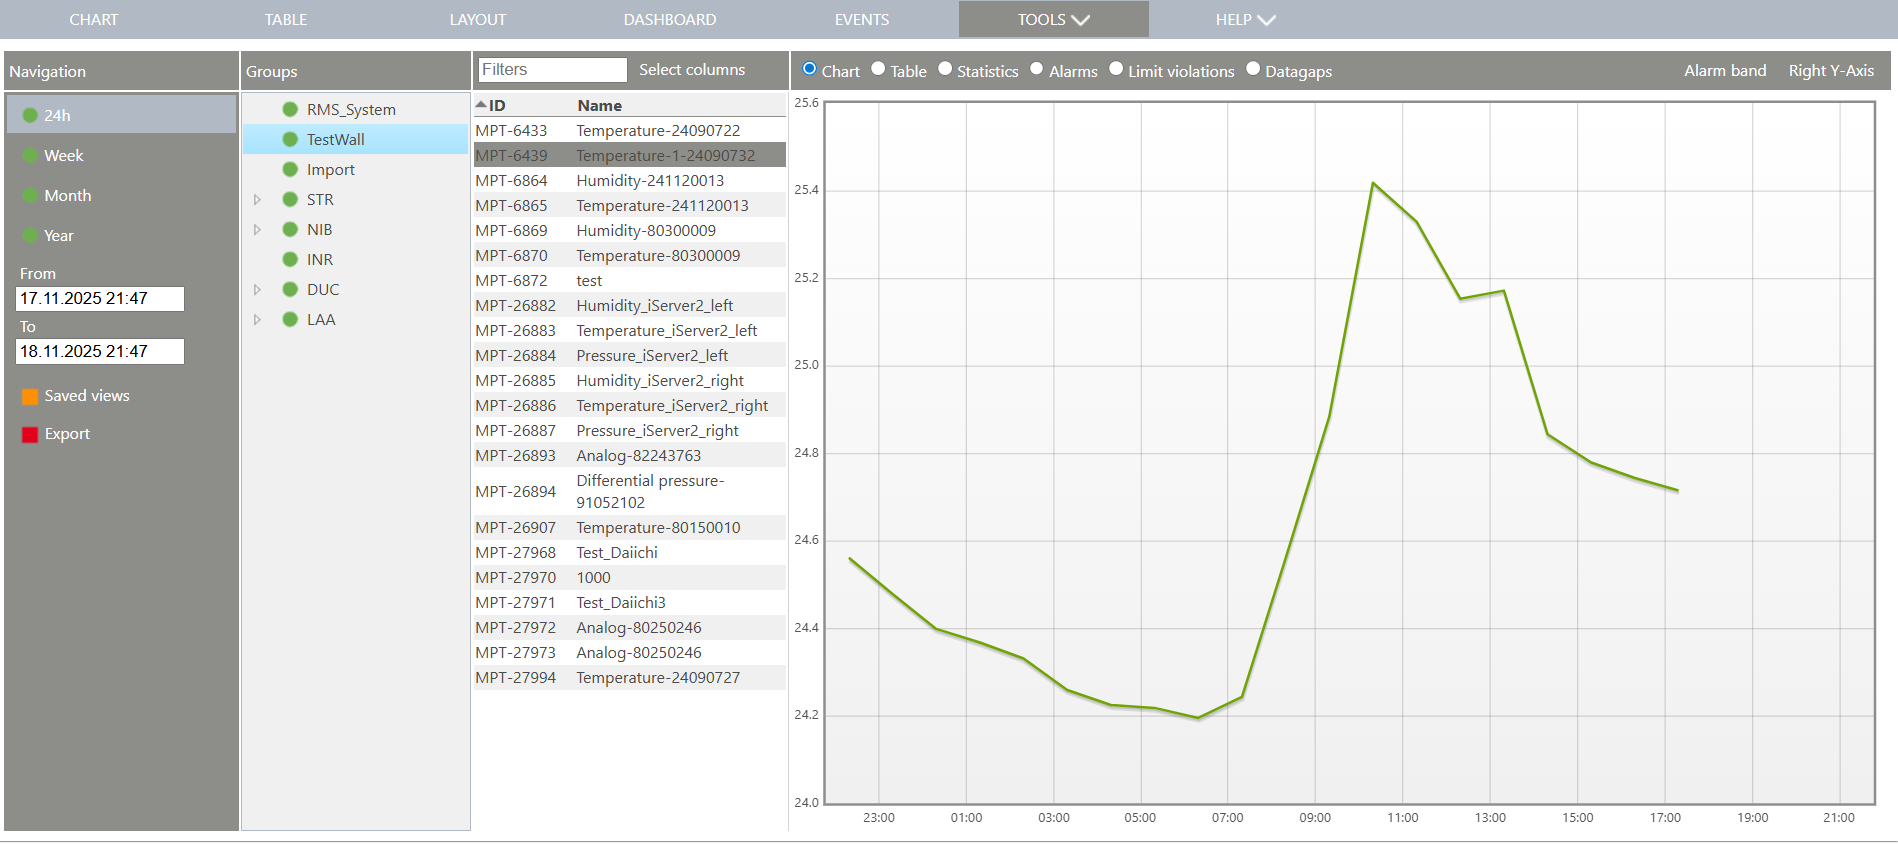 |
|---|---|
| Saved views | By clicking on saved views, the user can either save a view or load saved views. 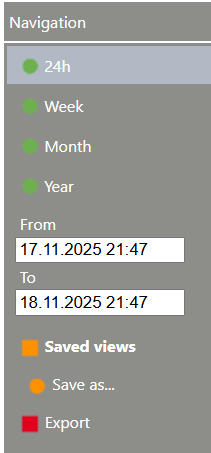 When saving a view by clicking on save as, the user can enter a new for the current view. Once saved, the view is visible under saved views and can always be selected. |
| Export | The setup (time frame and measuring points) can be exported in various formats: - CSV report. - PDF report. - JSON report. - Batch Release/Certification report. - Deviation report 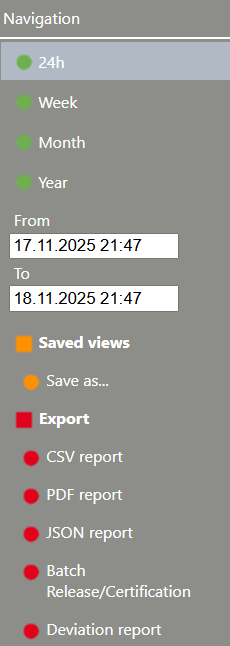 When exporting a PDF, the system offers the option to name the PDF, add an extension to the file name (current time, from time, to time and from and to time) and select a report template. Limitation: Limit violations is limited to 1'000 warning and 1'000 alarm limit violations. Batch Release/Certification report When exporting a Batch Release/Certification report the system offers the option to add a batch number, select the type of report (master batch report or production batch report), add the product as well as other details and comments. The user can select the option to add the chart trend lines. The user can select the option to review the report. The preview can be done to review the report before adding comments. If only preview is selected, the creation of the report is not included within the audit trail and the document is not created (DOC-XX). Only when clicking on create will the document officially be created under the audit trail and will obtain a DOC-XX number. 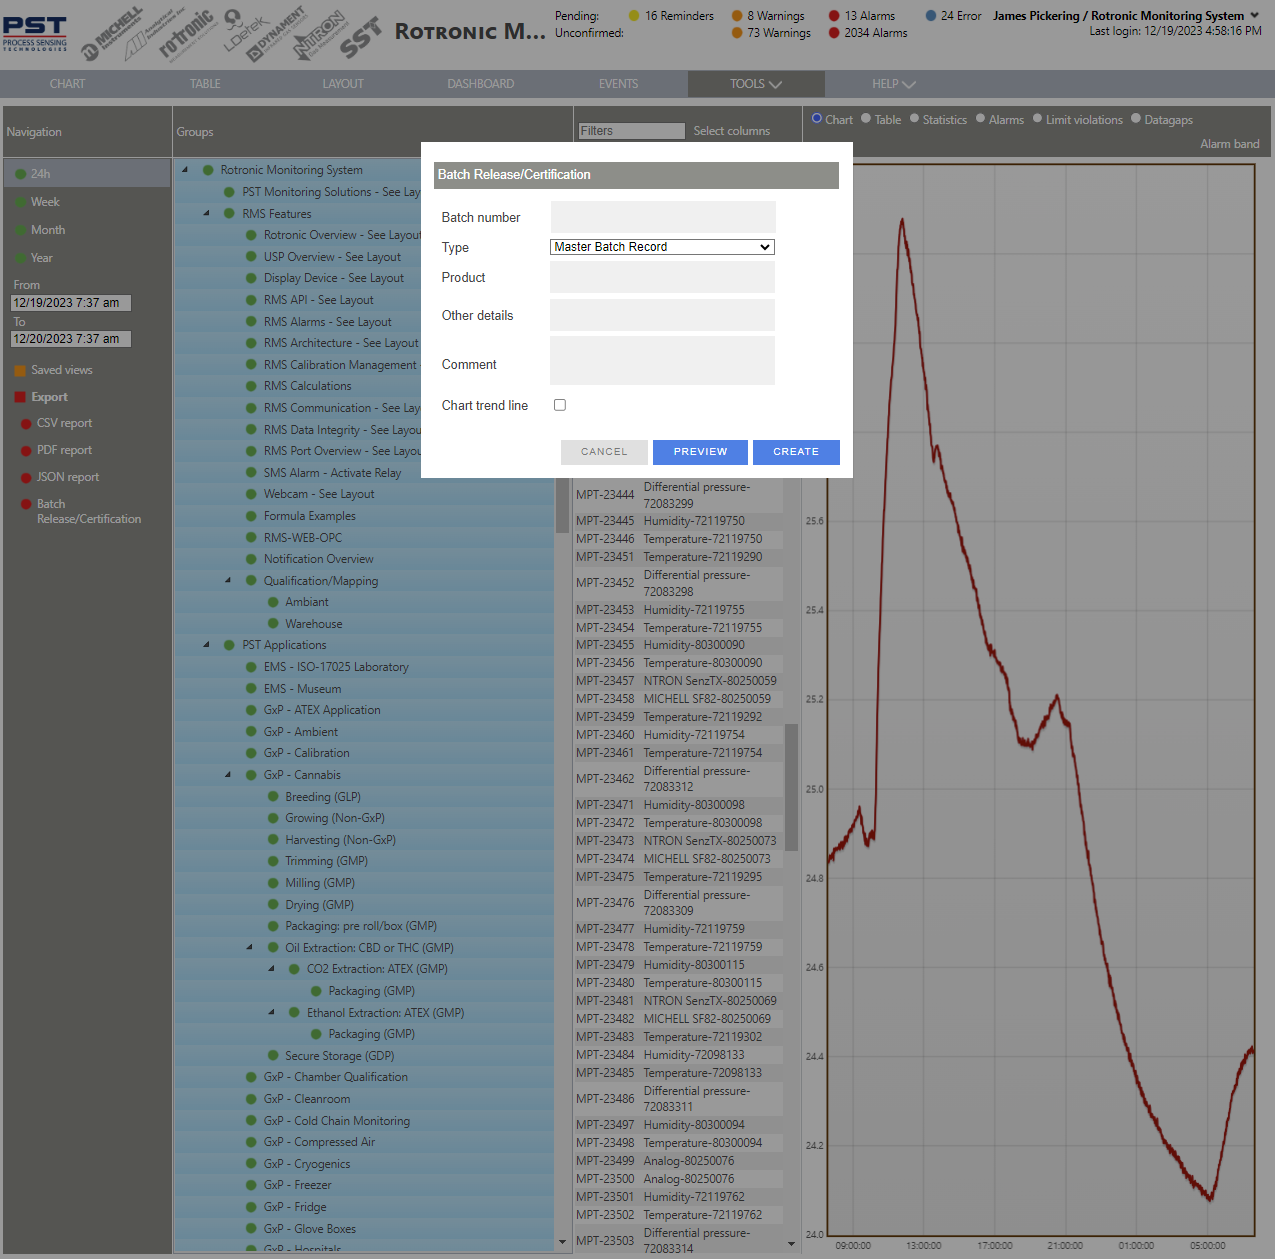 Limitation: Limit violations is limited to 1'000 warning and 1'000 alarm limit violations. |
| Update V2.8.0 | Second Y-Axis on the chart available 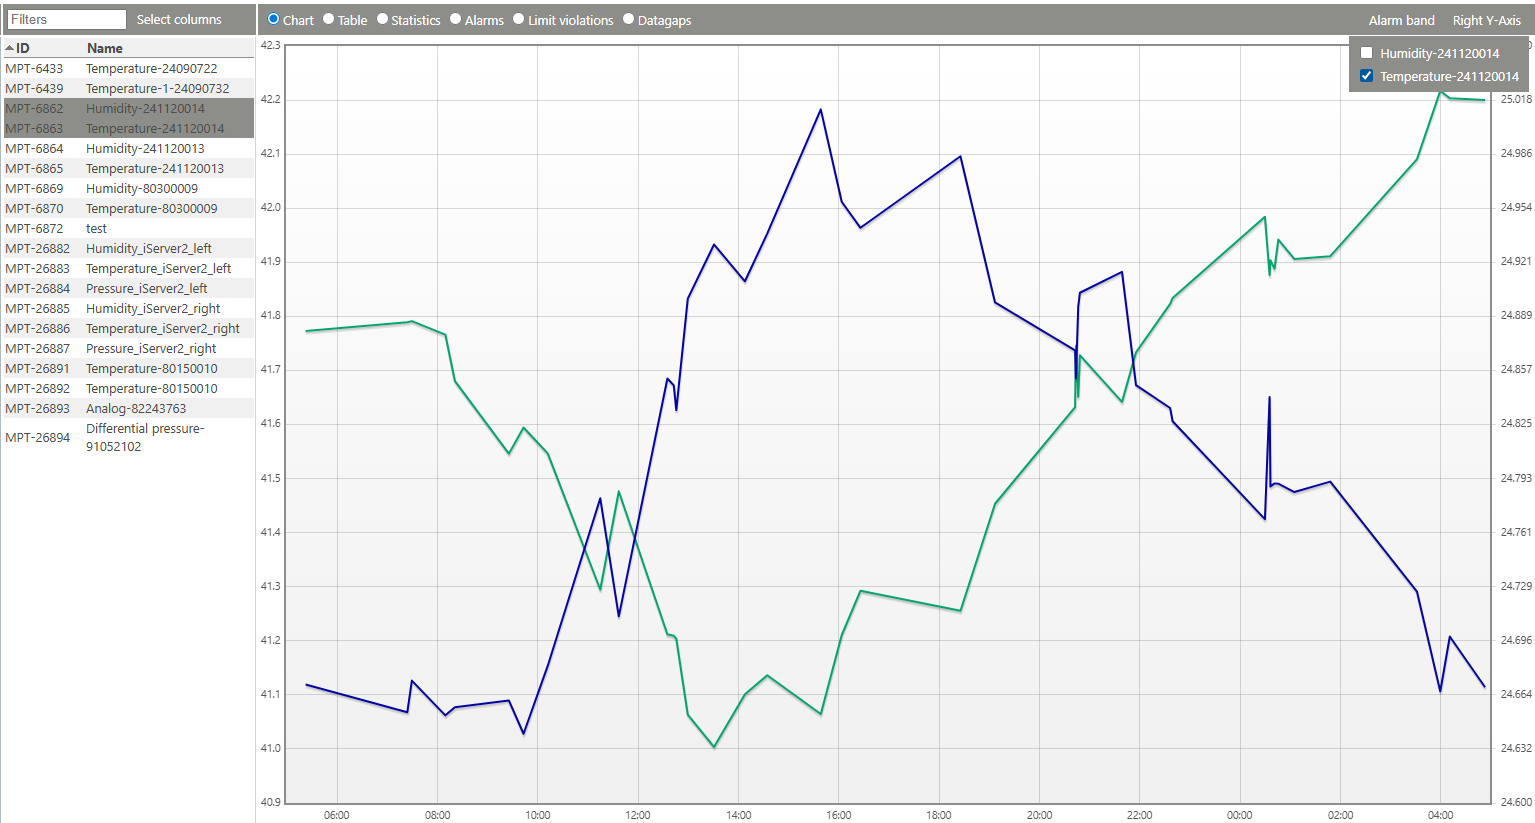 Multi-datapoints on chart A vertical cursor bar with active measurement values can be used for a better visualization. Is will be applied by the main chart and the chart of the data analysis. 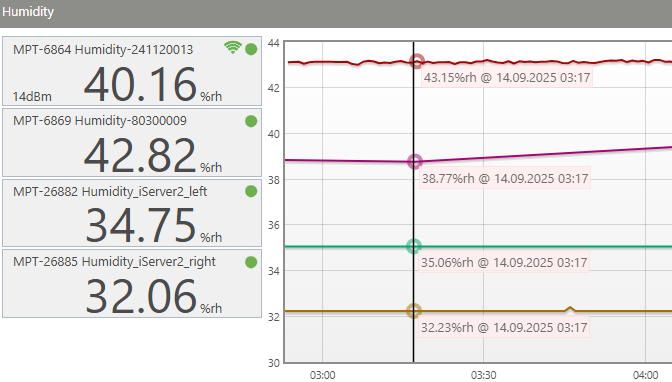 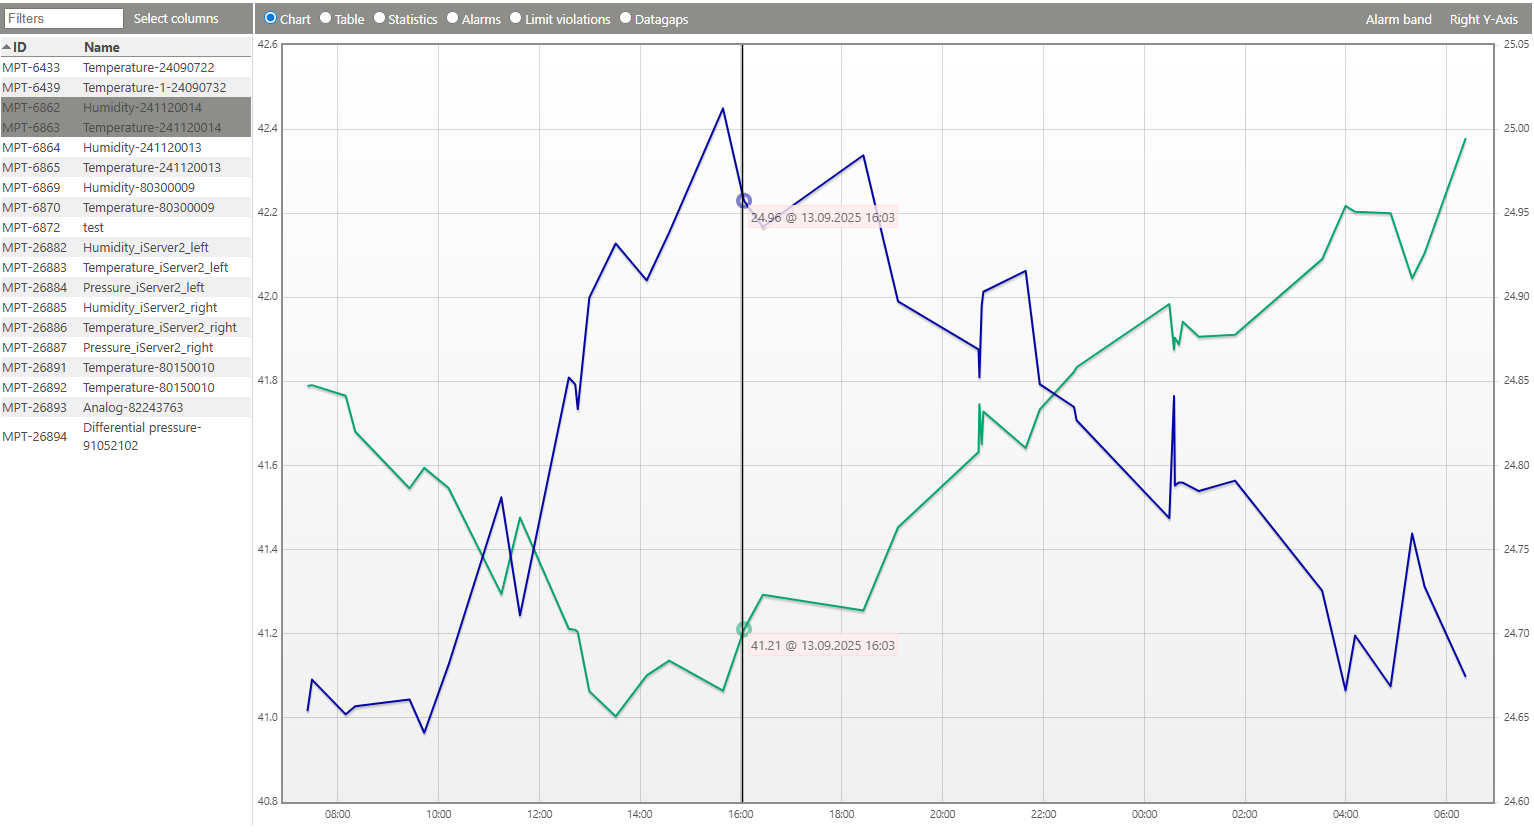 Activation under: Tools > Setup > System 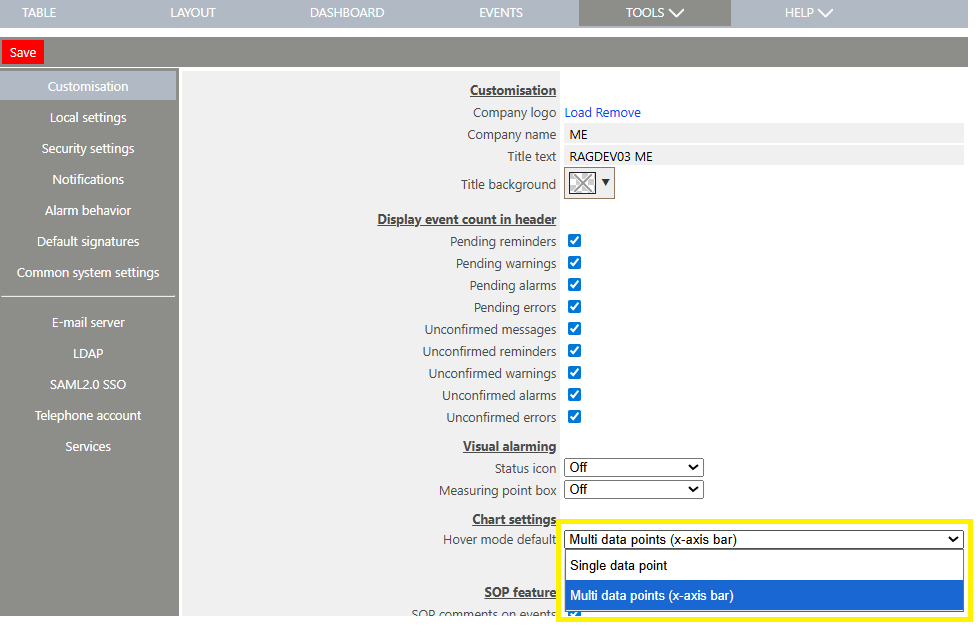 Deviation report export in data analysis Deviation report for the selected time span in data analysis - Report can only be created for a single measuring point - Each warning or alarm of the selected time span will be included in the report  |
| Print Screen 8 | The visualization can also be setup as a table view. A table of the selected measuring points over the selected time period will appear. 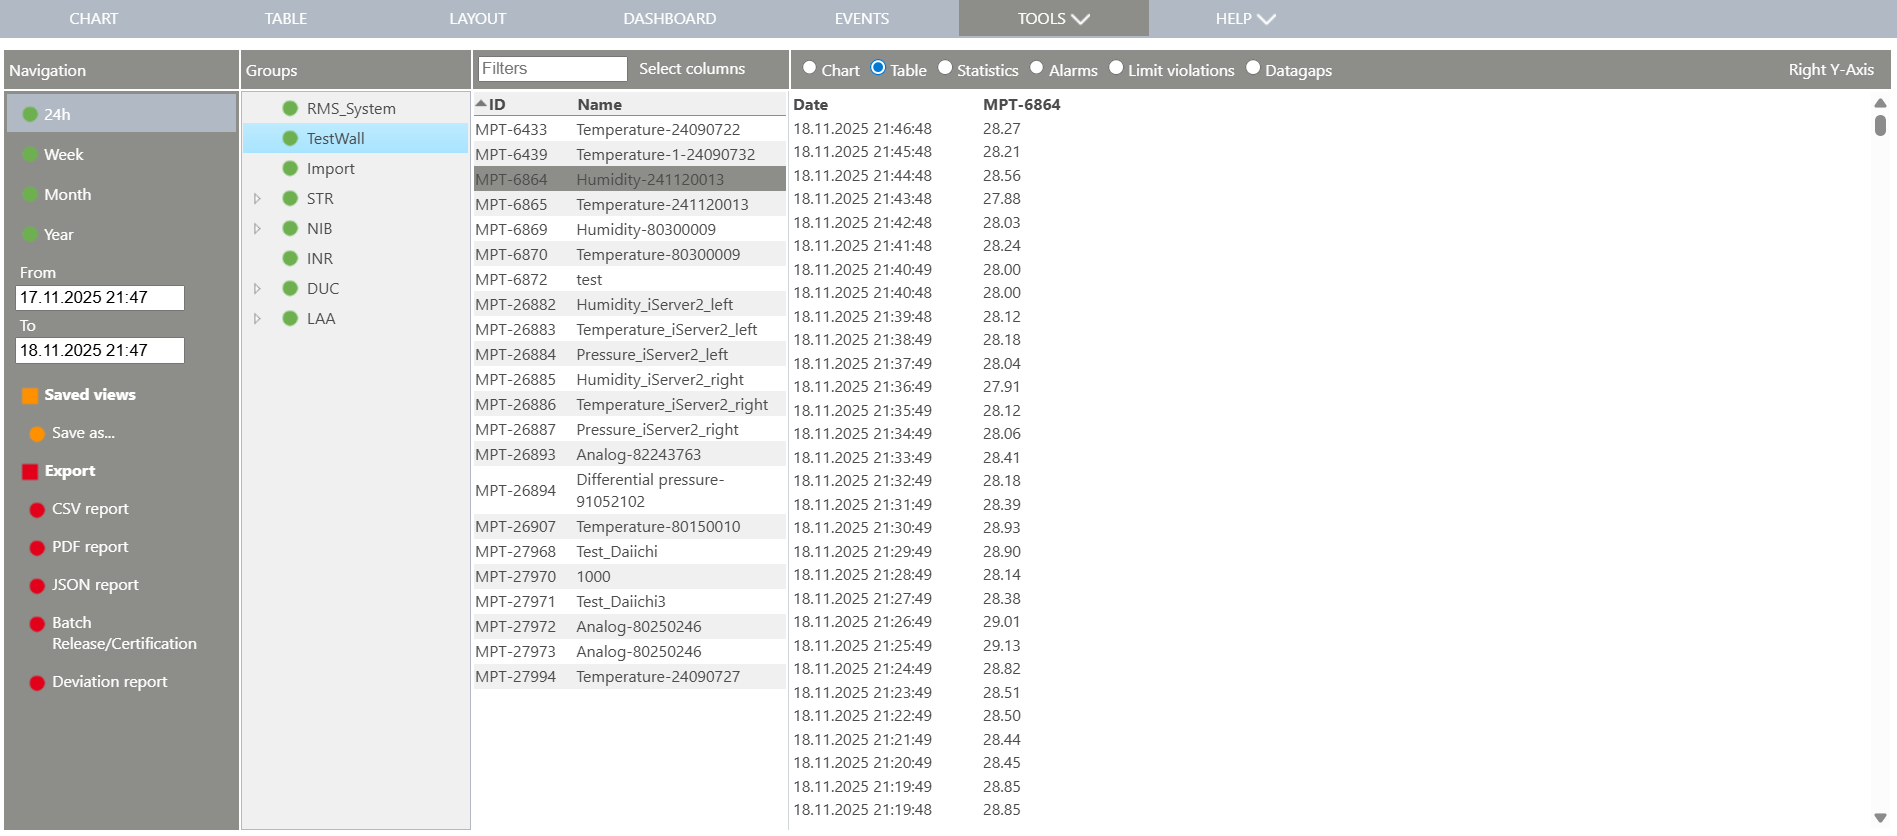 |
| Print Screen 9 | The visualization can also be setup as a statistics view. A statistics view of the selected measuring points over the selected time period will appear. 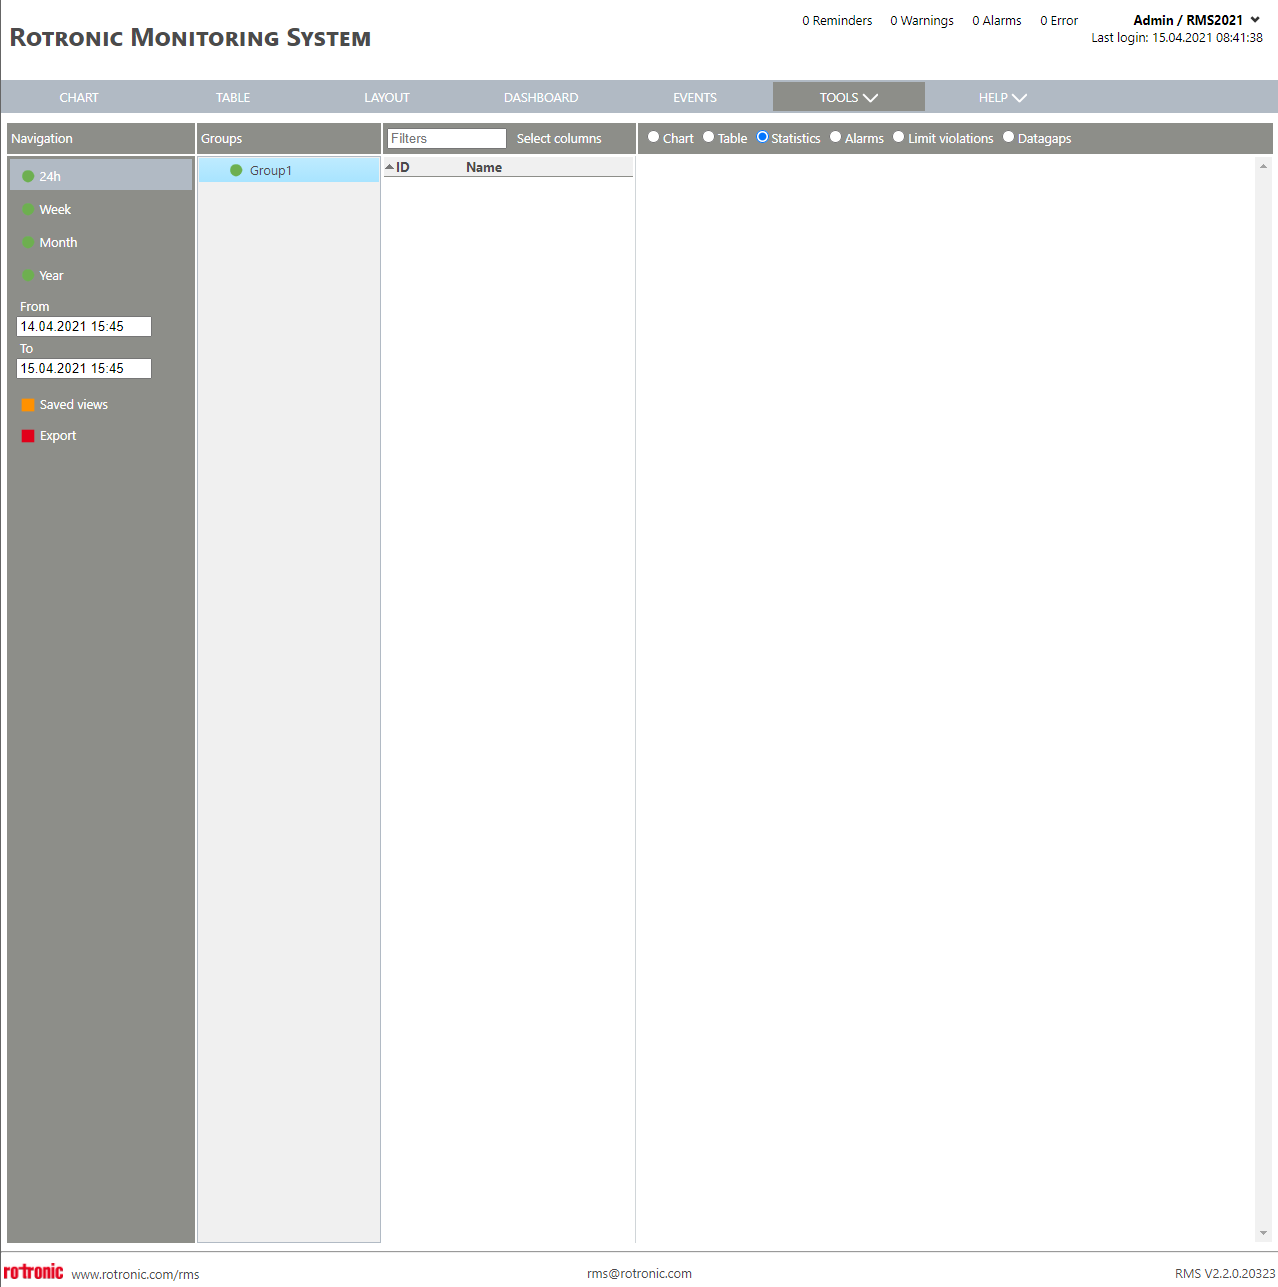 The following statistics are shown: - Number: Number of measured values within the selected time frame. - Min.: Minimum value, including date and time that it occurred within the selected time frame. - Max.: Maximum value, including date and time that it occurred within the selected time frame. - Average: Average value within the selected time frame. - Std. dev.: Standard deviation within the selected time frame. - Mean kinetic temperature: Mean kinetic temperature within the selected time frame. - Cp & CpK: Process capability within the selected time frame. The number of digits shown within the statistics will correspond to the "display digits" of the measuring points: Tools>Setup>Measuring Points Explained. |
| Print Screen 10 | The visualization can also be setup as an alarm view. A view of all warnings and alarms of the selected measuring points over the selected time period will appear. 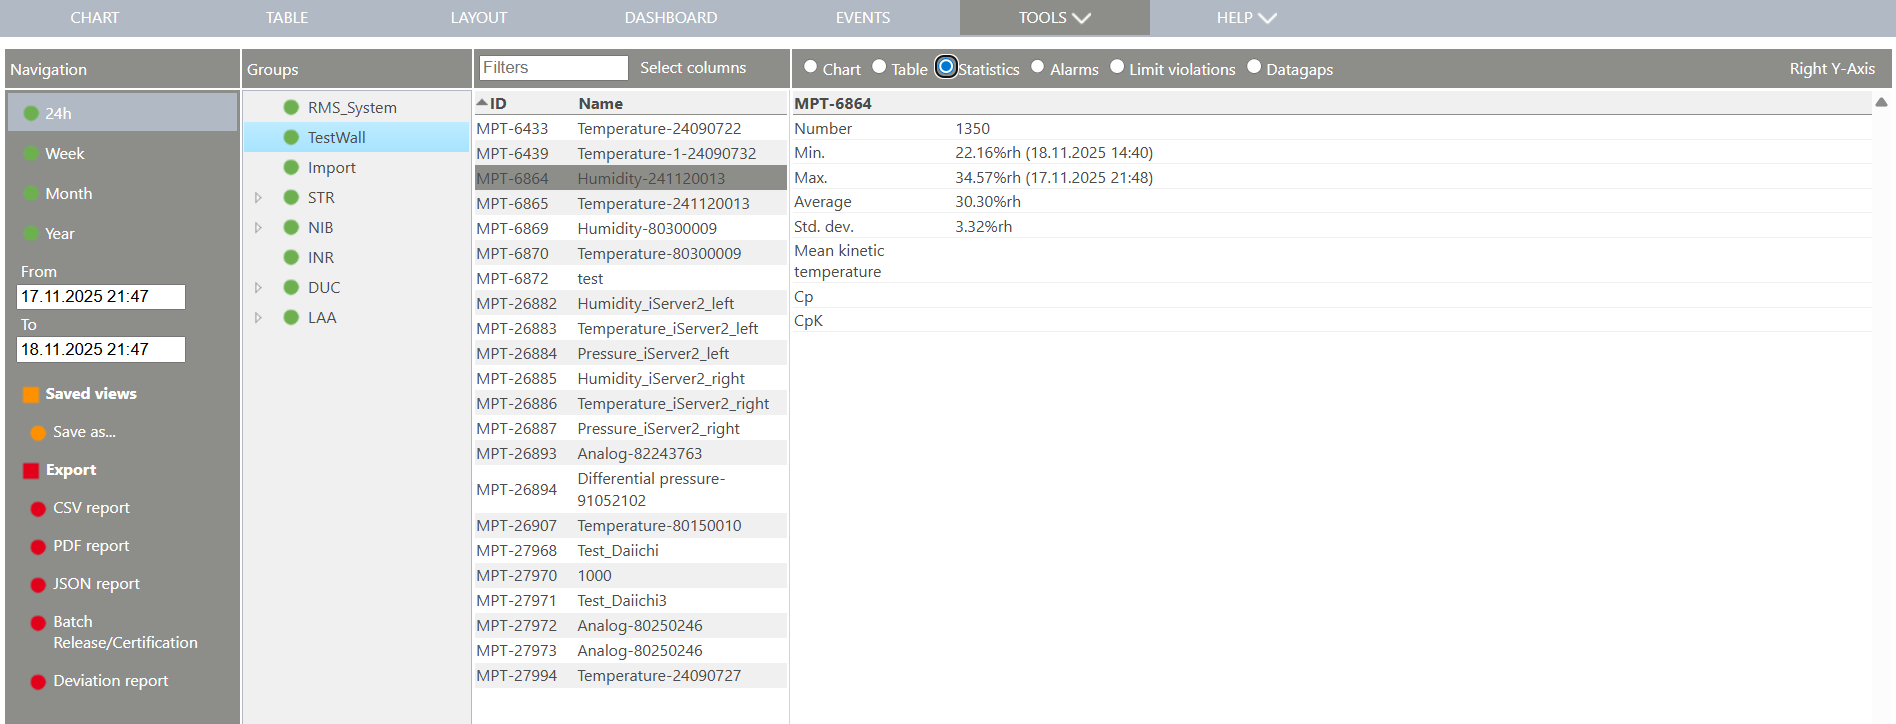 |
| Print Screen 11 | The visualization can also be setup as a limit violations view. A view of all warning and alarm limit violations of the selected measuring points over the selected time period will appear (limited to 500). 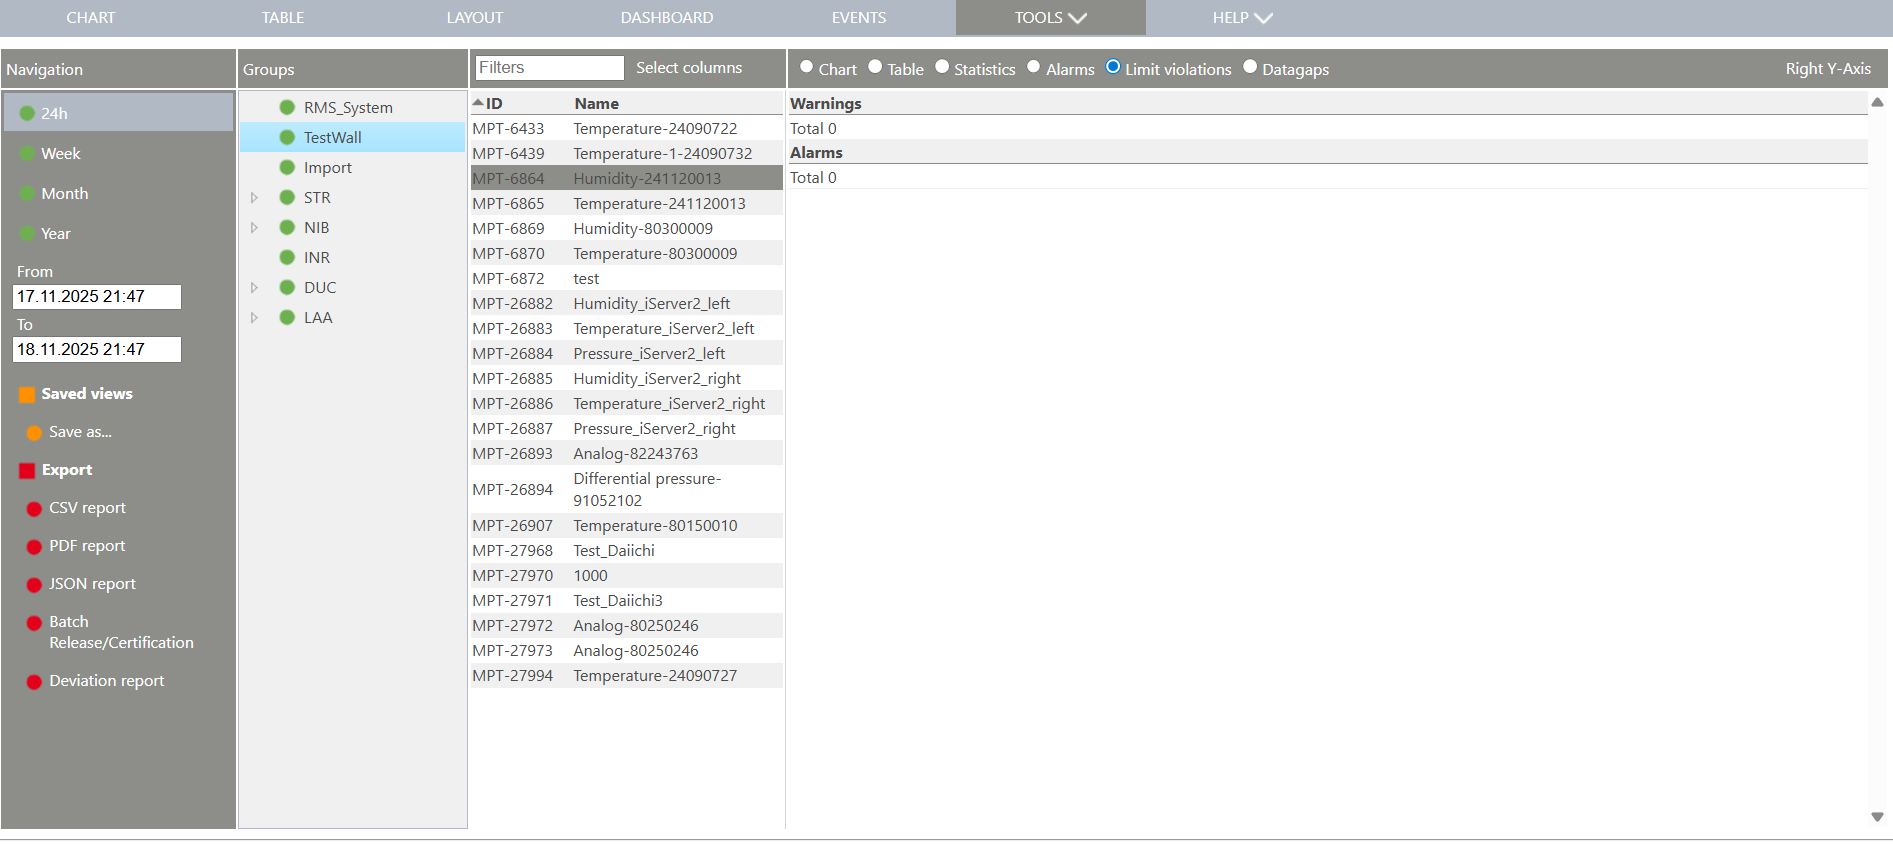 |
| Print Screen 12 | The visualization can also be setup as a data gap view. In this case, the software will check the data on the database meaning that the system will check to ensure that all of the data is available. A view of all data gaps (limited to 500) will appear stating: - From. - To. - Duration. - Measuring point ID. - Device ID. - Data gap event ID. - Status: - Action link. The user has the possibility to click on the action link: - Create a data gap event: - Retry to download the data from the device: - Close data gap: Limitation: A change of the measuring interval within the selected time span will not be detected and results in a lot of false not reported data gaps or not detected existing data gaps. 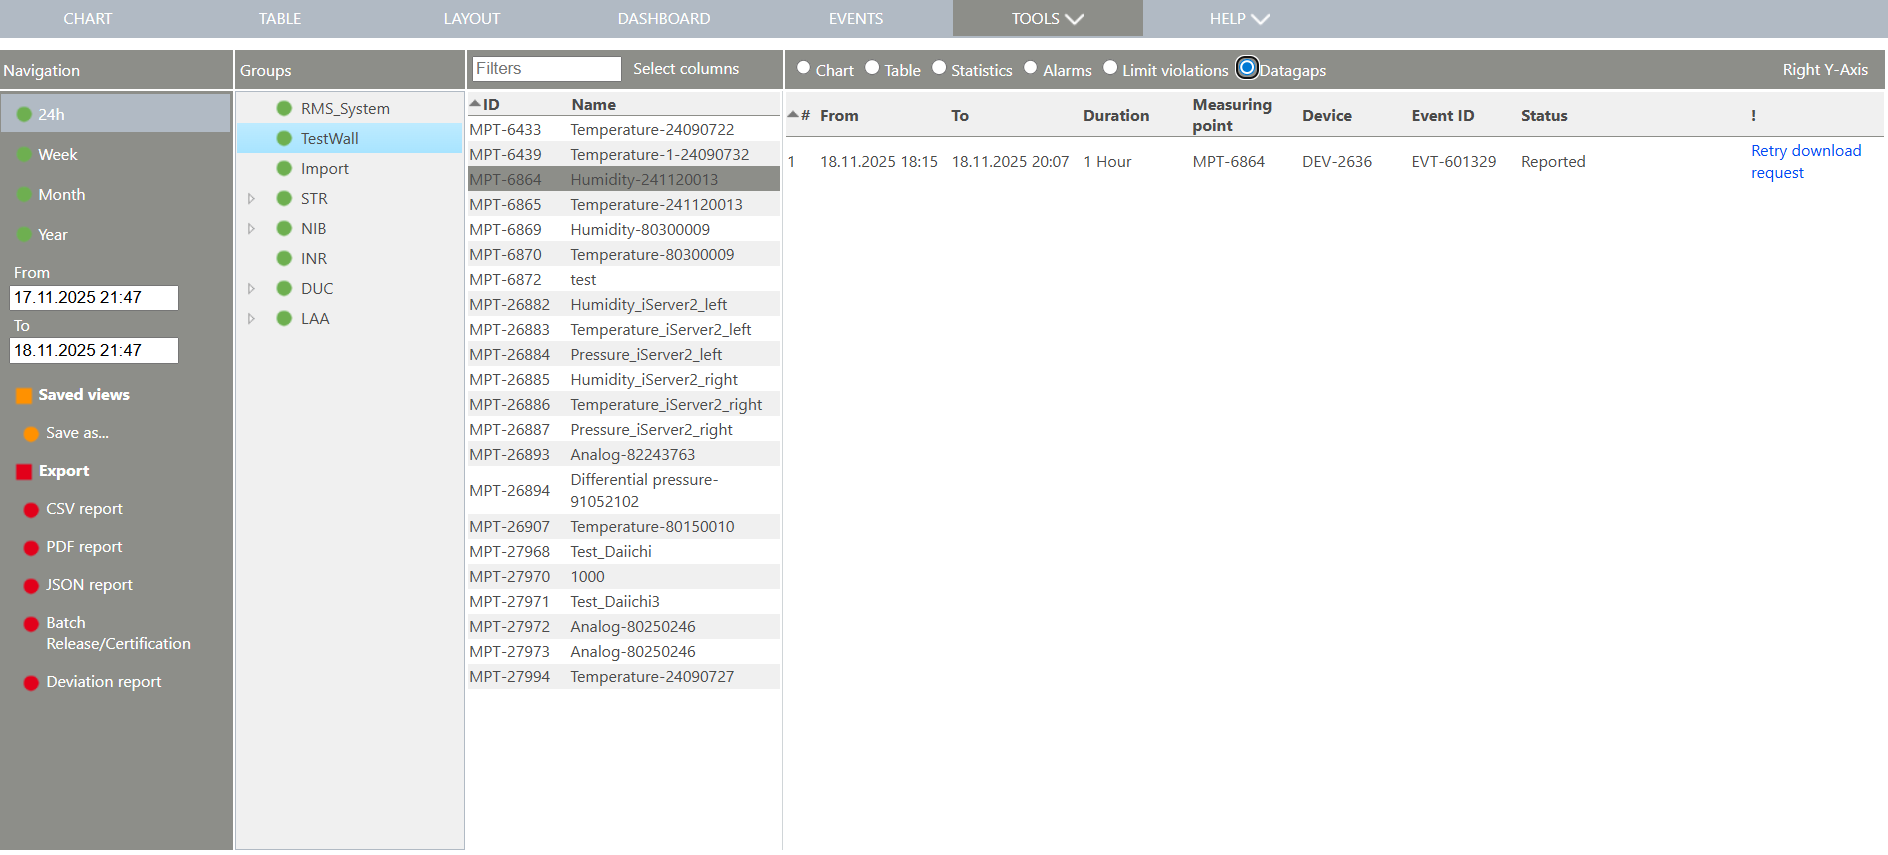 |
| Update V2.9.0 | Add a comment to a chart The user has the possibility to add a command to a chart. - First please click on a measuring point in the chart and enter a free text note. 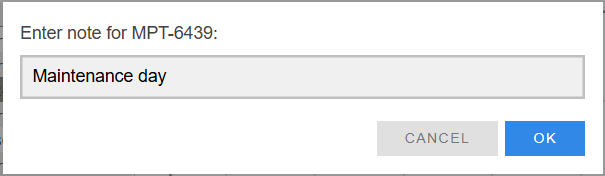 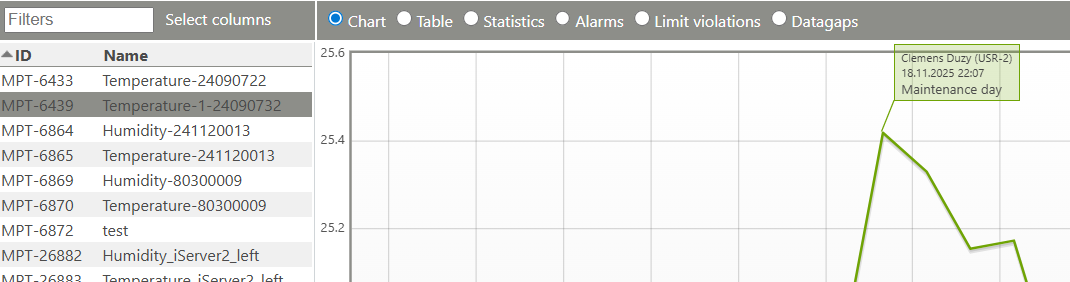 - The note can be deleted by clicking the delete icon.  Please note: The RMS Administrator can control the use of notes via user rights. He can assign the rights View, Add and Delete in the "View" section under Data view (notes).  |
Updated: 18.11.2025